Betelgeuse
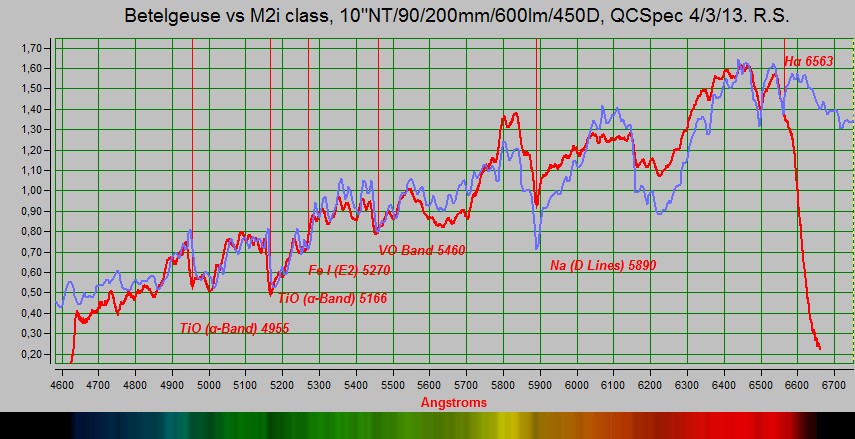
Red: Slit-less spectrum of Betelgeuse, QCSPEC with 600 l/mm on the 10" Newtonian. A surprising feature was the Vanadium-Oxide band. Blue: a reference spectrum contained in the software RSPEC. The red line drops off beyond Hydrogen alpha because of a modified IR filter that has a sharp cutoff here. The cool atmosphere reveals itself by the molecular bands and the "Planckian upslope" towards the red end of the spectrum.

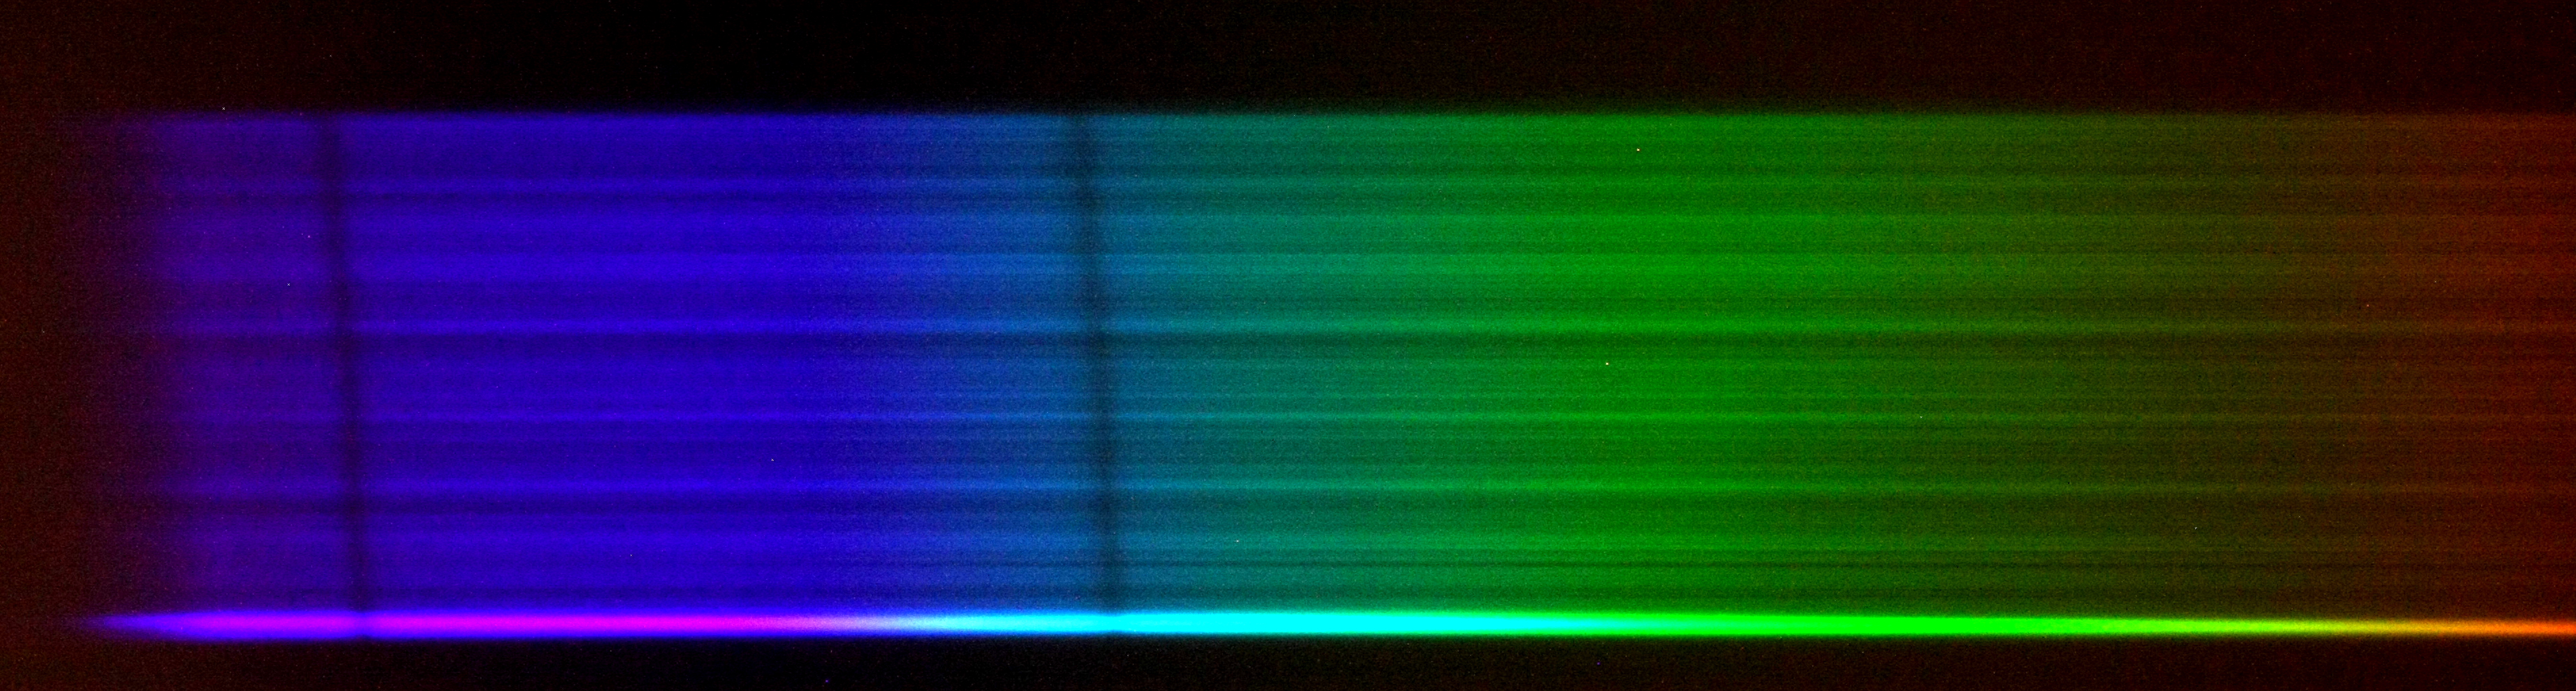
This is a slit-less "drift spectrum" of Betelgeuse obtained by simply turning off the telescope tracking, and the result is spectacular I think, in terms of a powerful visualization. This is the lazy way of taking spectra! The bright ends (upper and lower strips) are obtaied by letting the telescope track there.
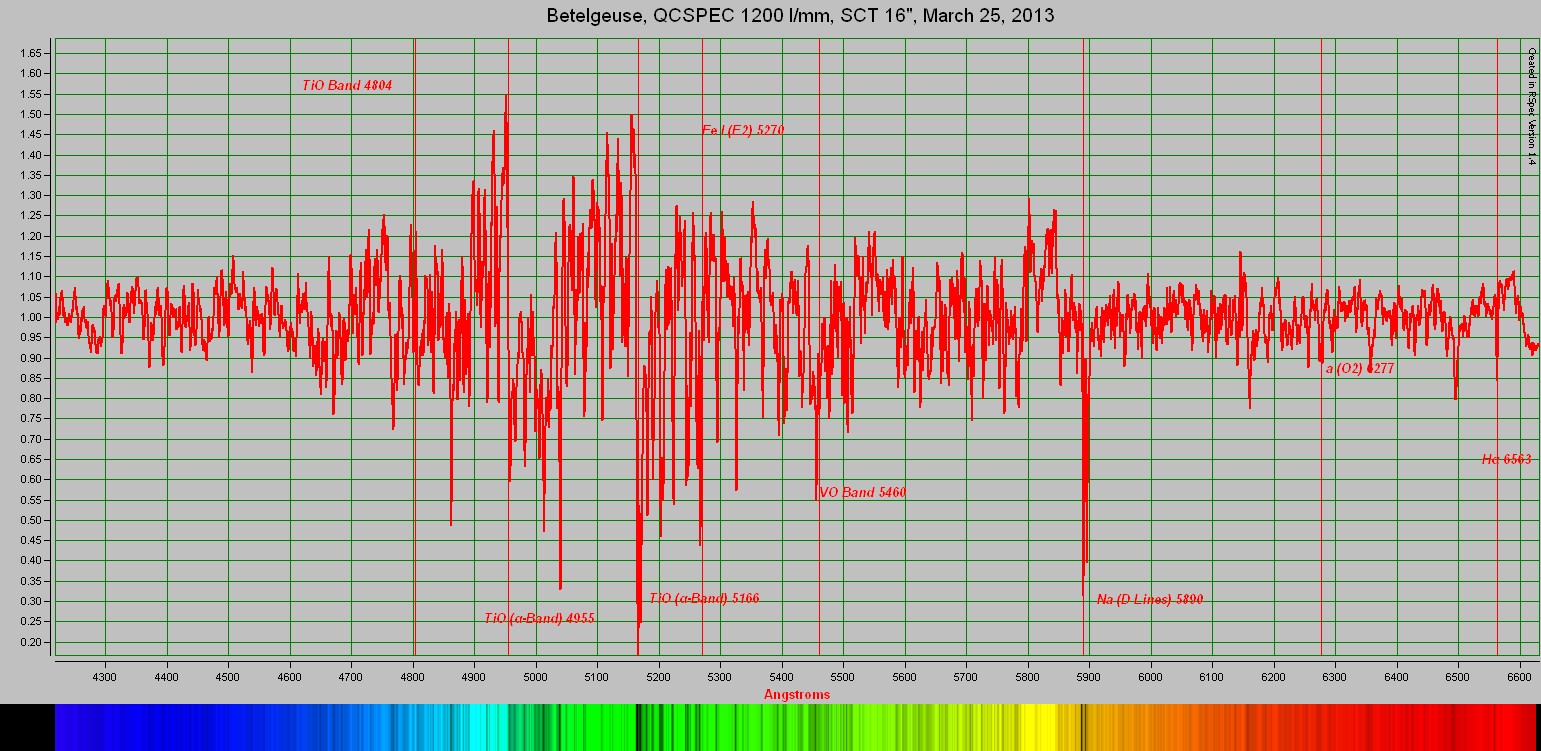
A higer resolution spectrum of Betelgeuse, with a 1200 l/mm grating on a 16" Schmidt-Cassegrain, and with a very narrow high precision slit. The improvemment is very dramatic compared to the slit-less, lower dispersion version above. The contunuum background variation is subtracted off, and the full spectrum is composed of four different spectra covering different wavelength ranges. The resolution is about 1A (0.1 nanometers).
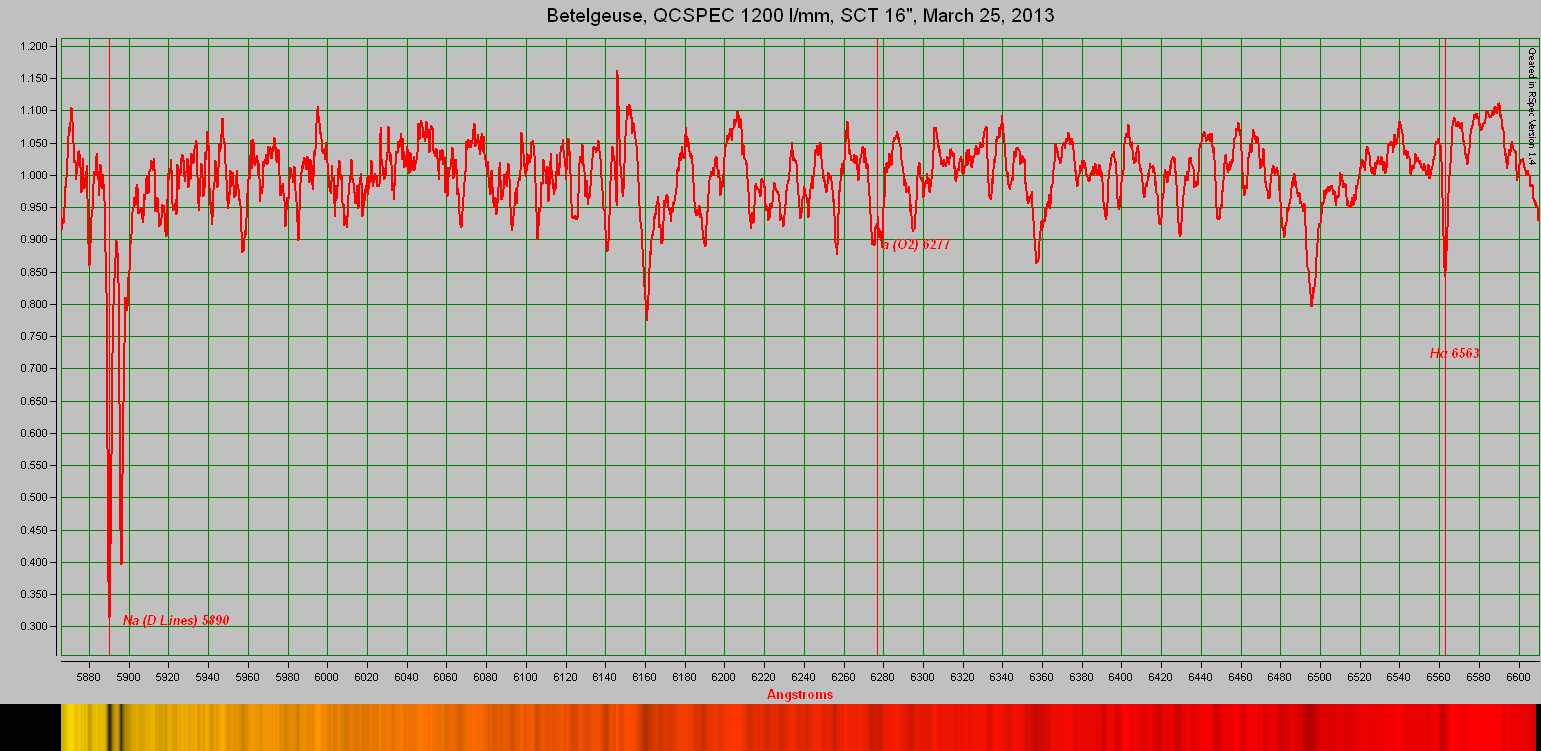
A zoom from the Sodium lines to Hydrogen-alpha. Note that the Sodium lins are strong as for the Sun, as shown under the "Solar section", but the Hydrogen alpha line is relatively weaker in Betelgeuse. This is also a reminder that Betelgeuse and the Sun contains common elements, although the giant Betelgeuse is much larger and much cooler than the Sun!
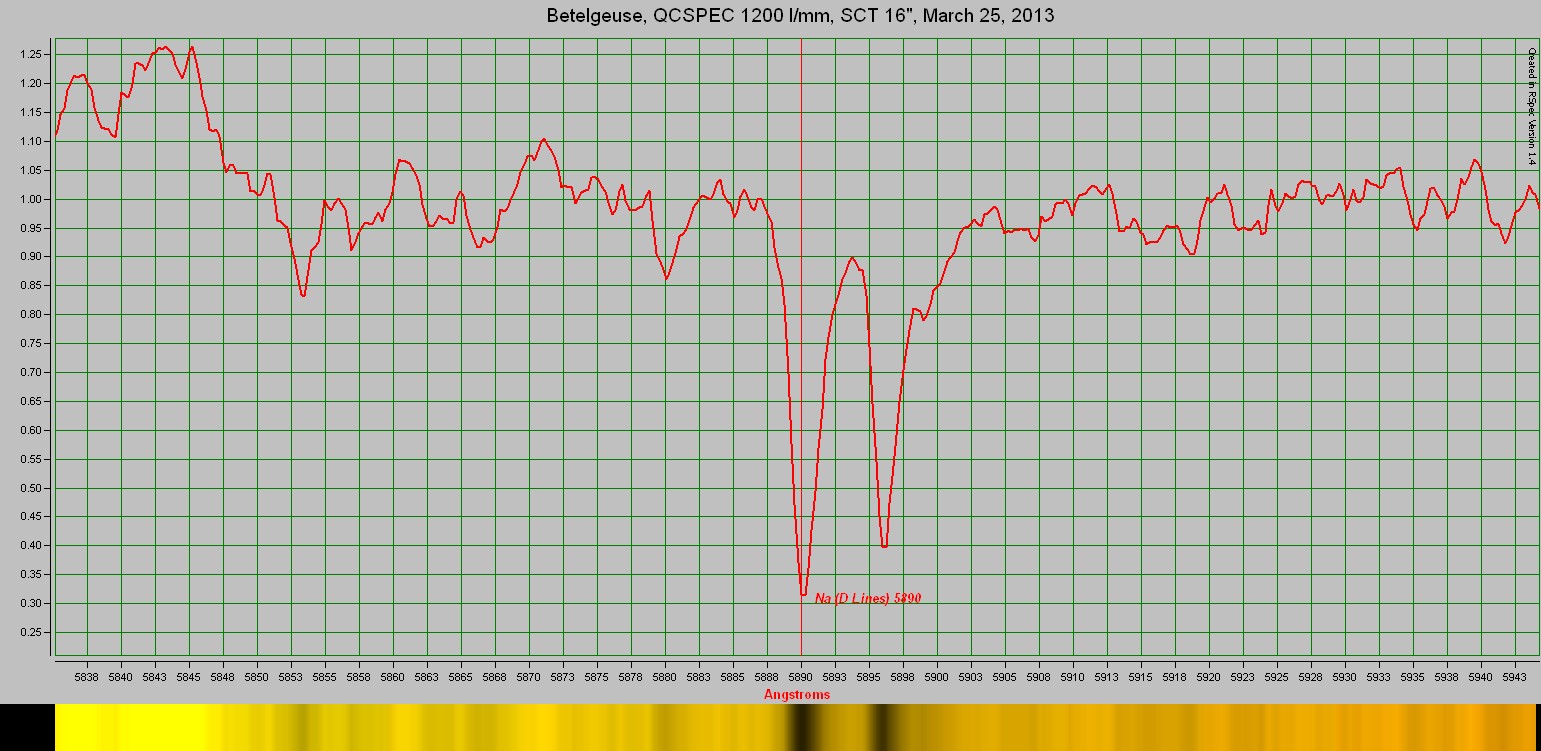
A zoom-up on the Sodium lines in Betelgeuse.
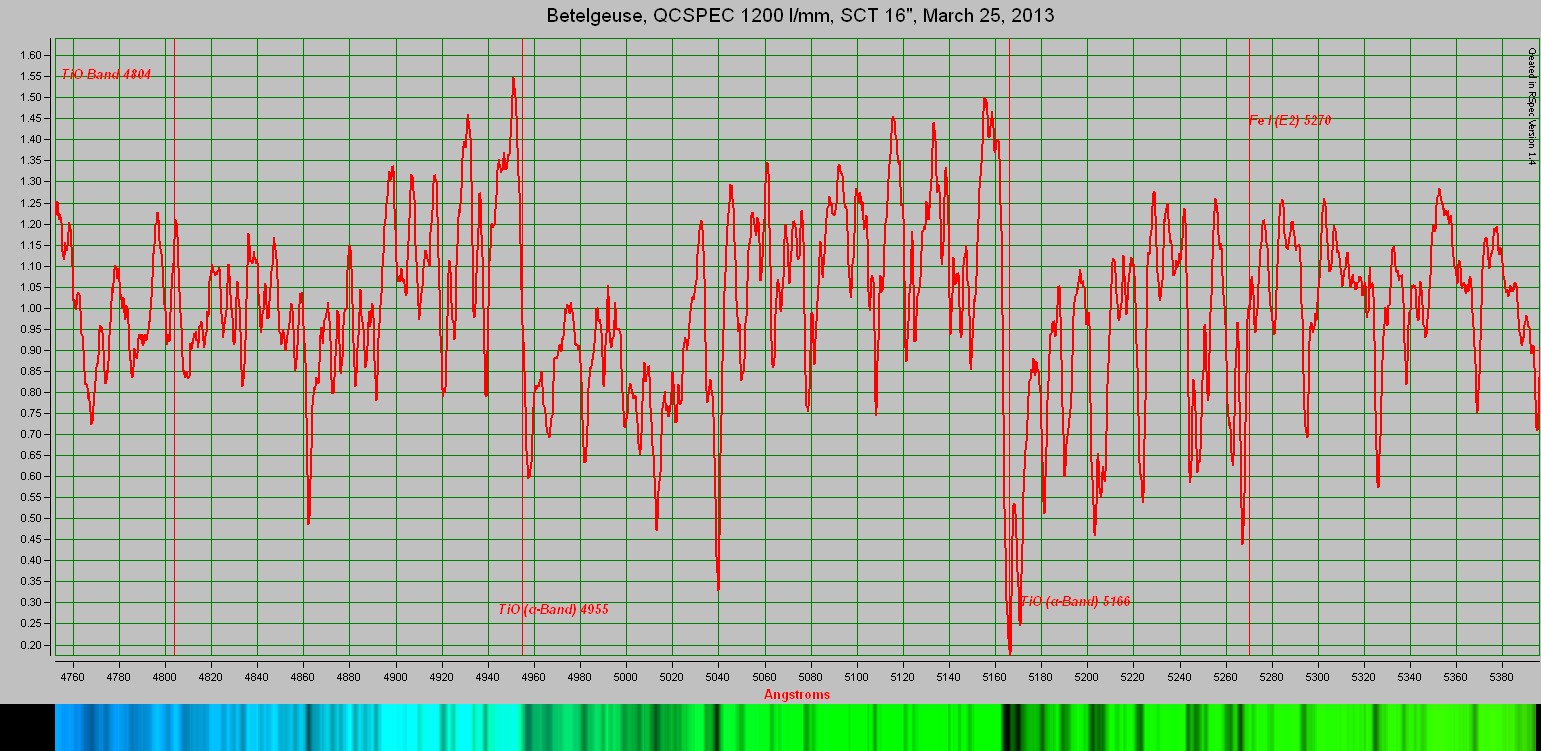
Titanium oxide alpha bands. A closer look at the 5166-region is given under "Stars with model spectra" and "Cool stars" where a model spectrum is computed to reveal the complexity of line blends between TiO molecules and heavy atoms. There, it is demonstrated that most of the the wiggles in the spectrum are real spectral line blends (and not noise)!
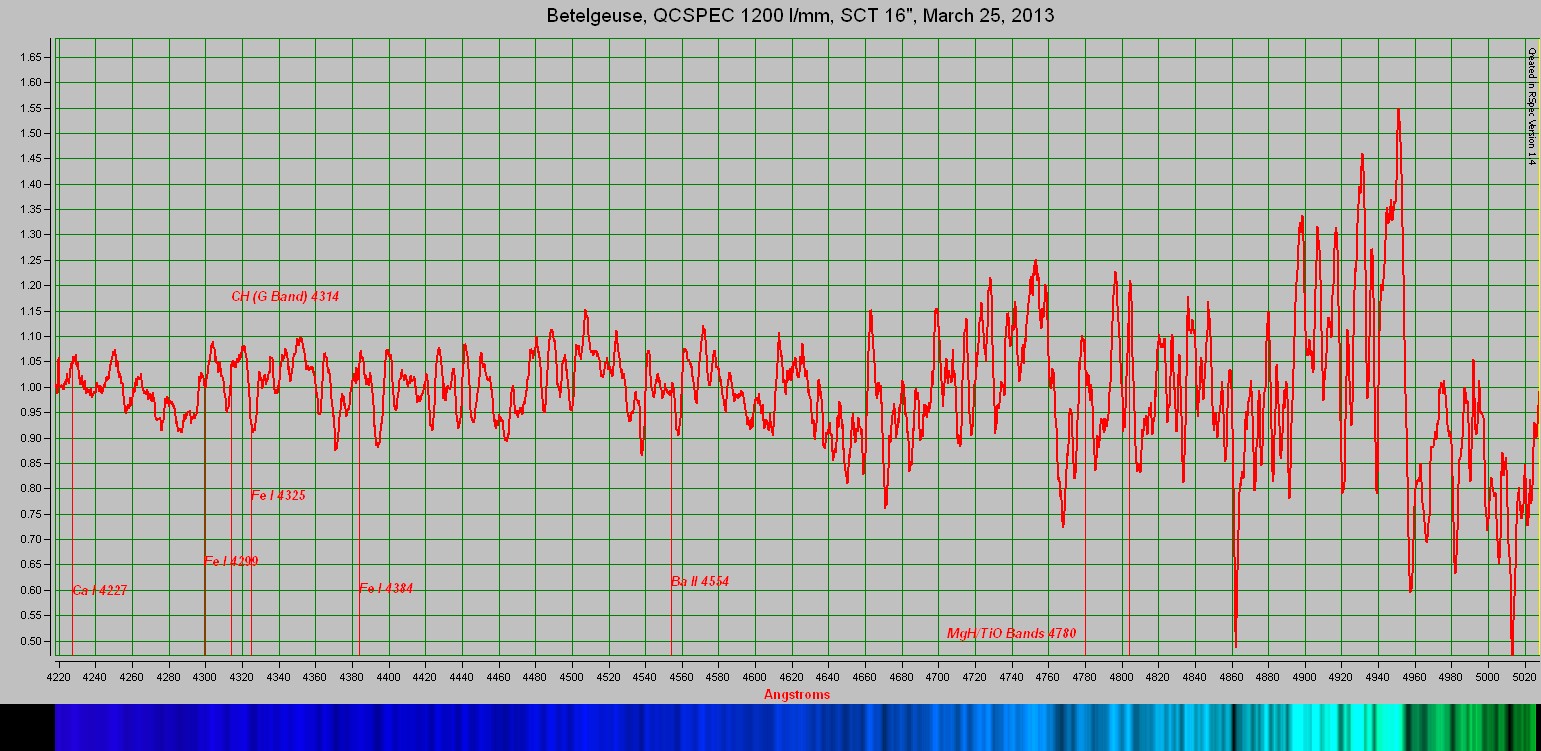
From a Calcium emission in the near ultraviolet via Barium to a complex band of Magnesium-Hydride and Titanium oxide.
Capella
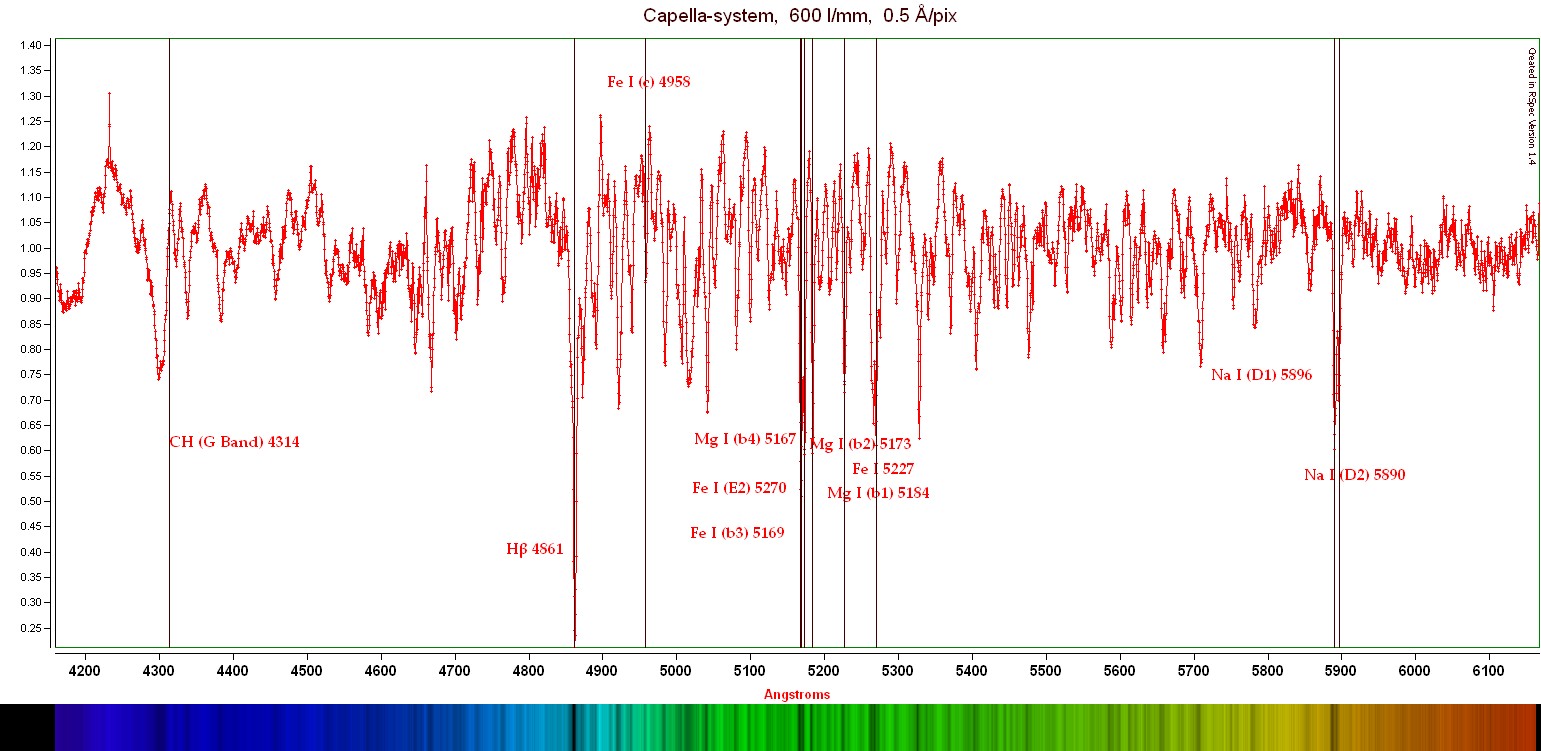
QCSPEC with 600 l/mm on the 10" Newtonian. The Capella system is two large G-type stars orbiting, and another binary system of weak red dwarfs. The spectrum is dominated by the G-stars. The continuum has been subtracted in this and the following spectra. A strong H-beta line, Magnesium lines, and the Soudium-doublet is seen, similar to the Sun, which is a G2V star.
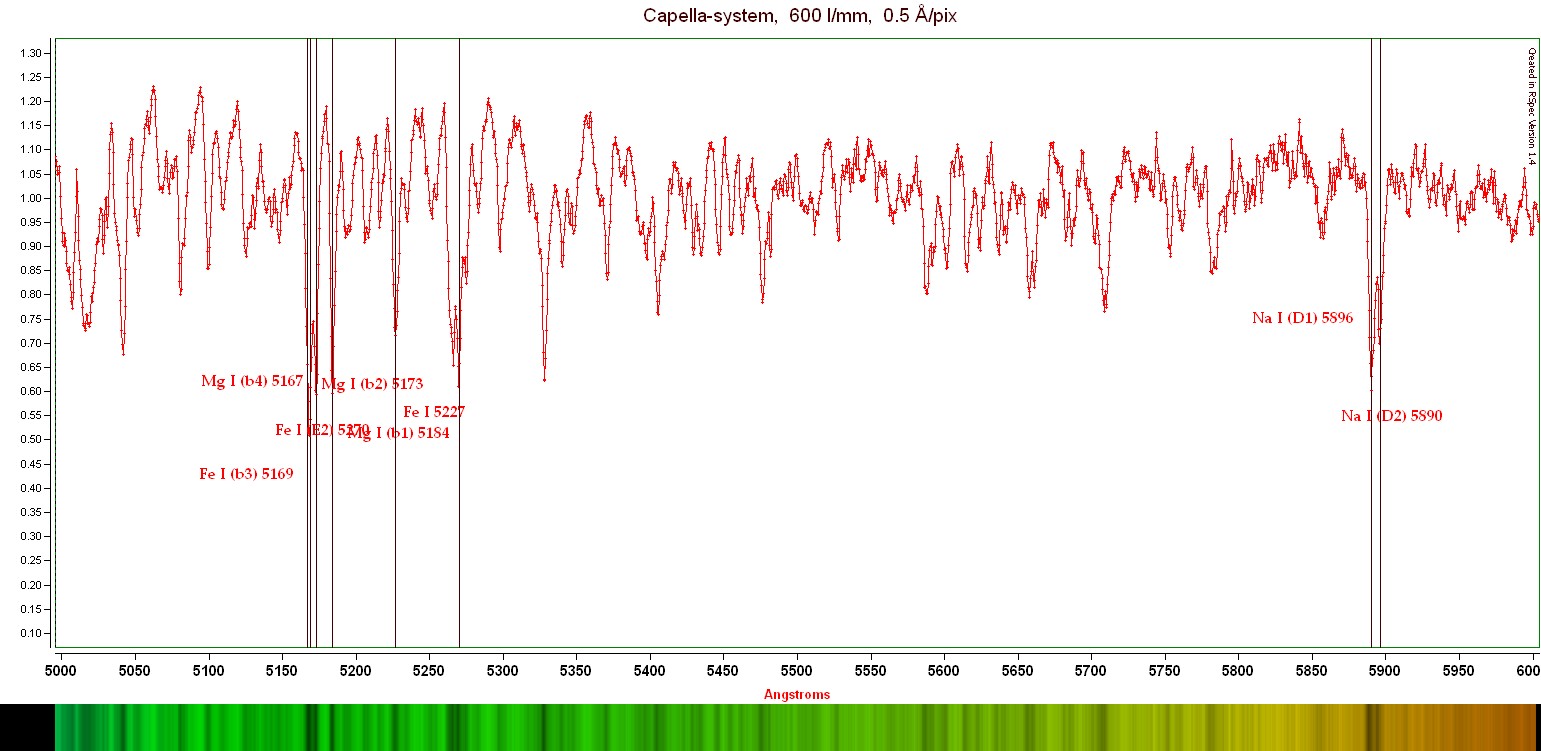
Zoom into the Magnesium-to-Sodium region.
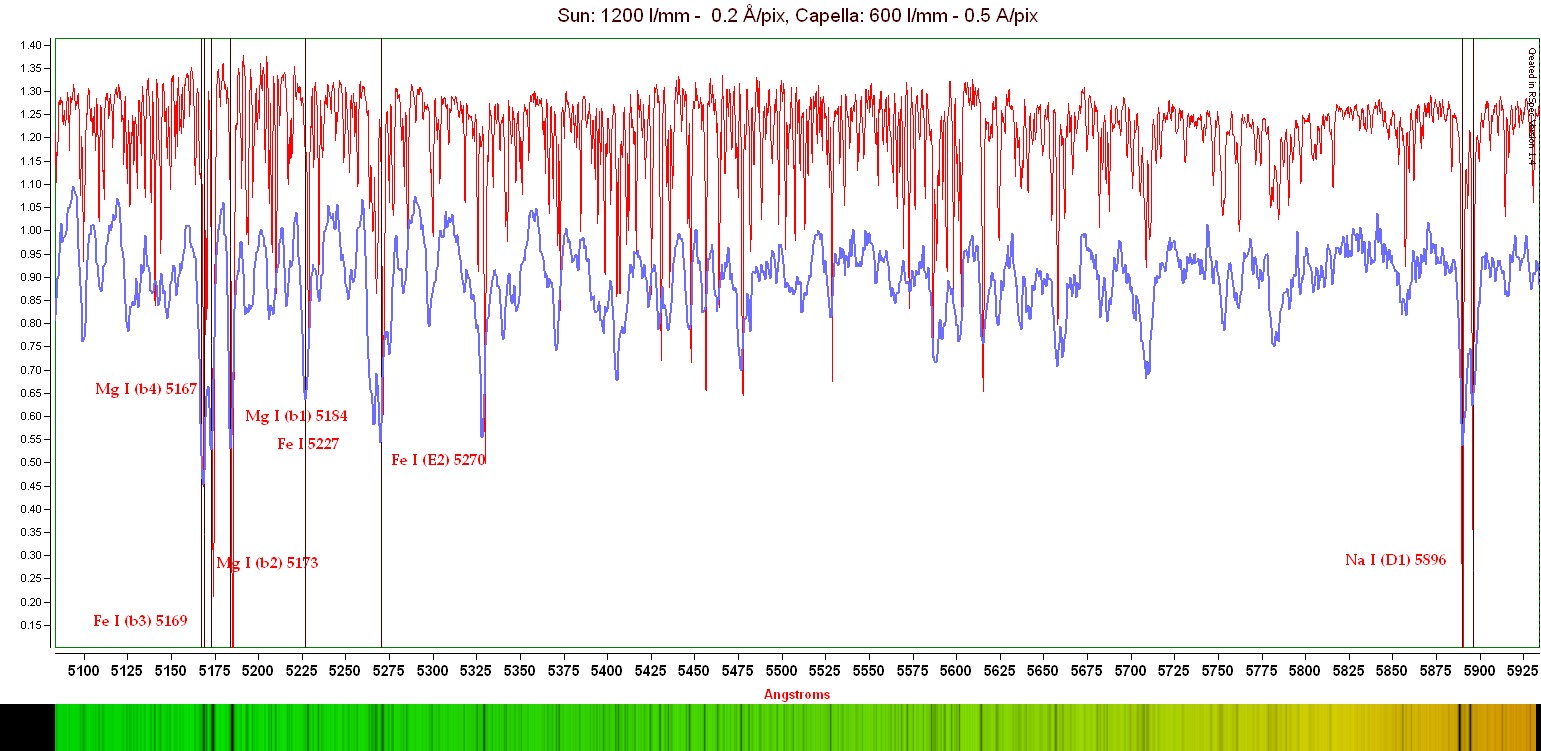
Capella (blue) compared to the Sun (red). Since both are G-type stars, they have similar spectra. The Capella system has left the main sequence (starting out as a different spectral class on the main sequence) and are about to be come giants, so there are differences in the spectra as compared to the Sun. These spectra have different resolution so quantitative comparison is difficult, but the similarities are very clear. Although not demonstrated here, it seems that the H-beta line is stronger in Capella (seen in the first spectrum above) than in the Sun. The colored spectrum in the bottom is the solar data as well.
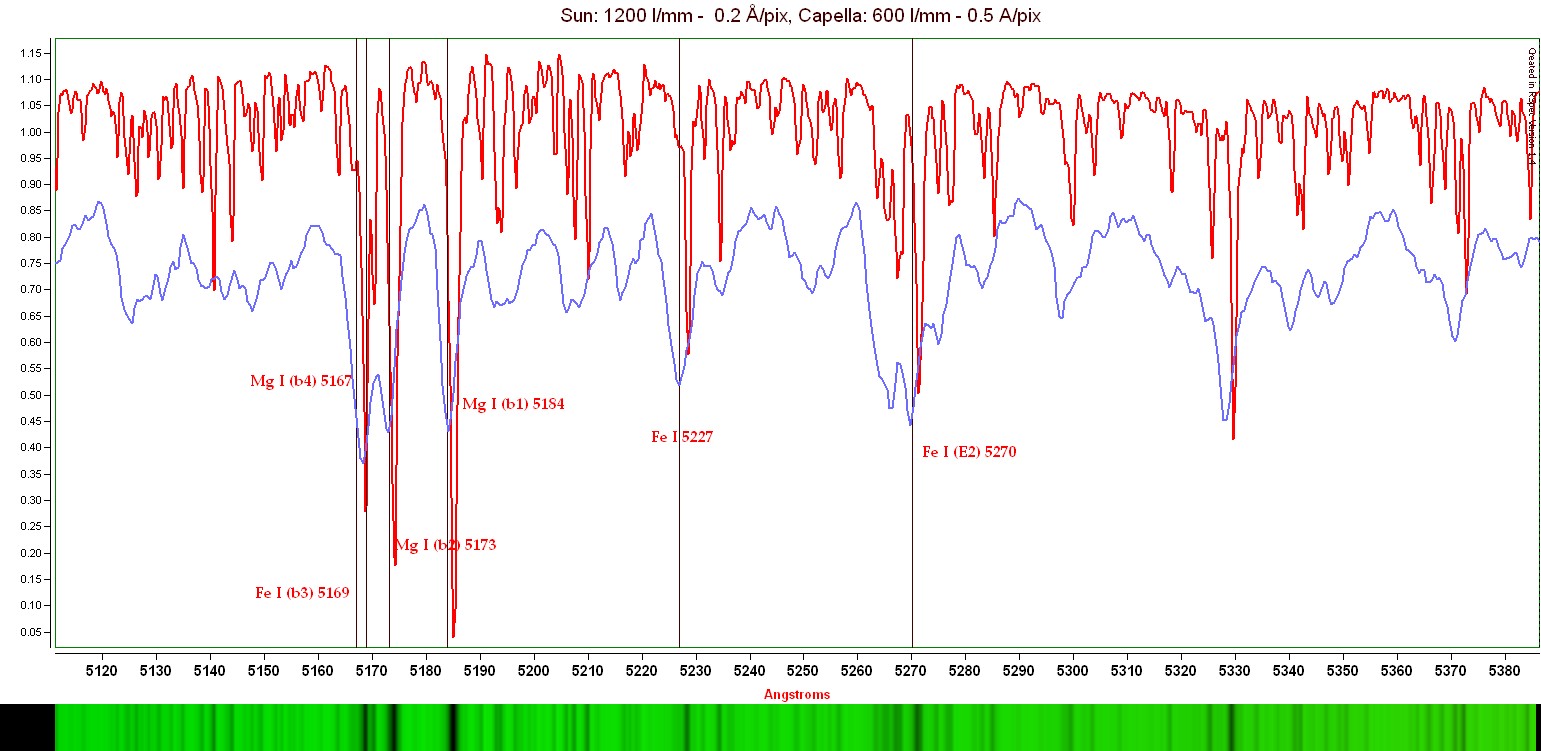
Zoom left of the above.
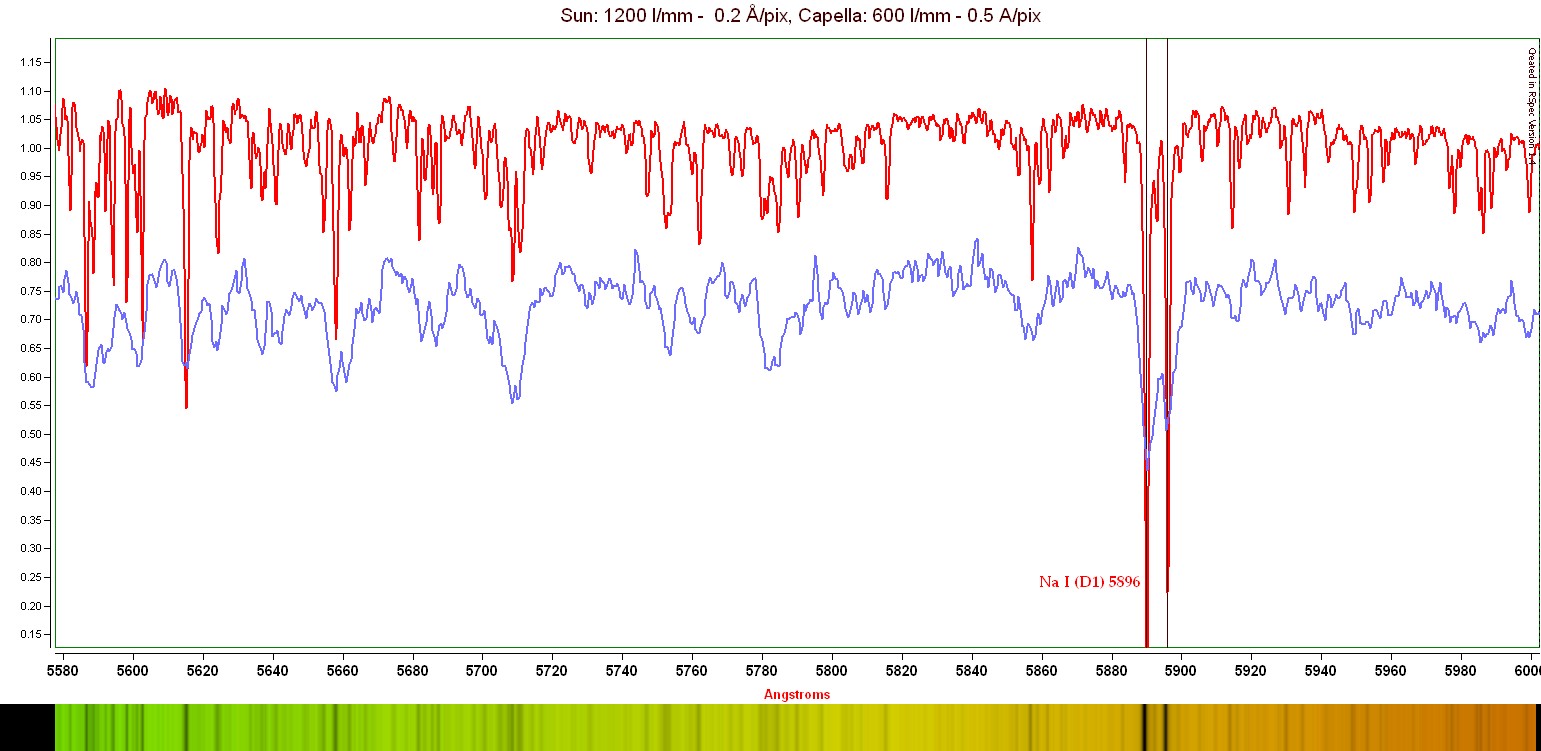
Zoom right of the above.
Castor
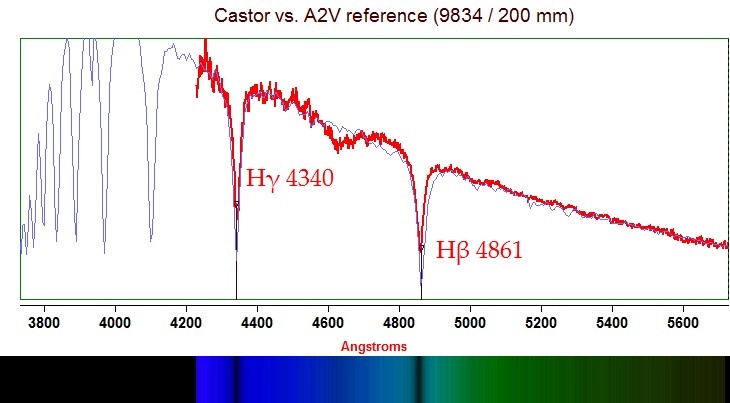
Red: data. Blue: reference spectrum (comes with the Rspec software). QCSPEC with 600 l/mm. Castor has very broad Hydrogen lines due to the Stark-effect, which is broadening due to the electric field of nearby atoms.
Regulus
A drift spectrum of Regulus, showing the strong Hydrogen lines too, similar to Castor. QCSPEC with 600 l/mm.