Details in a Titanium Oxide band in Betelgeuse
LTE modelling using a Kurucz Atlas 12 atmosphere model, and the SPECTRUM code by R. O. Grey.
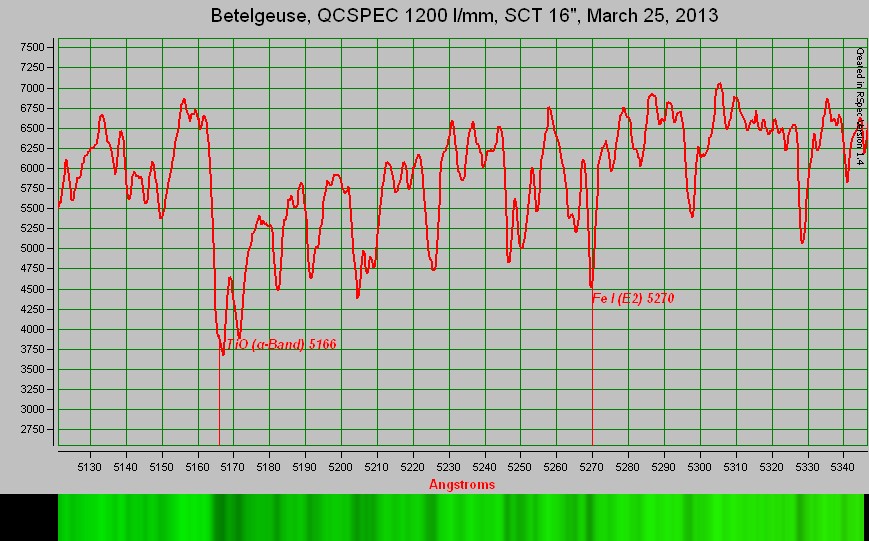 The measured spectrum of Betelgeuse over the TiO (Titanium Oxide) molecular band near 5160 Anstroms and above, including a strong iron line at 5270. The QCSPEC was used with 1200 l/mm, and a narrow slit giving a resolution of about 1A. The spectrograph was mounted on a 16 inch f10 SCT.
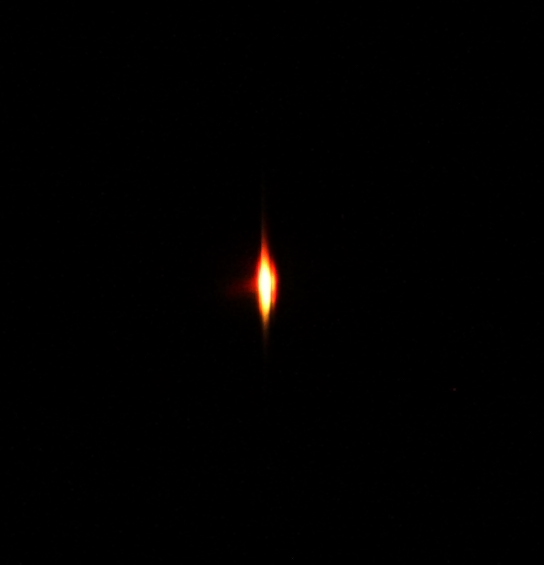 An overexposed slit image at zero order.
I recommend using "Ctrl +/-" for zooming in and out, otherwise the labels in the spectra are not necessarily readable!
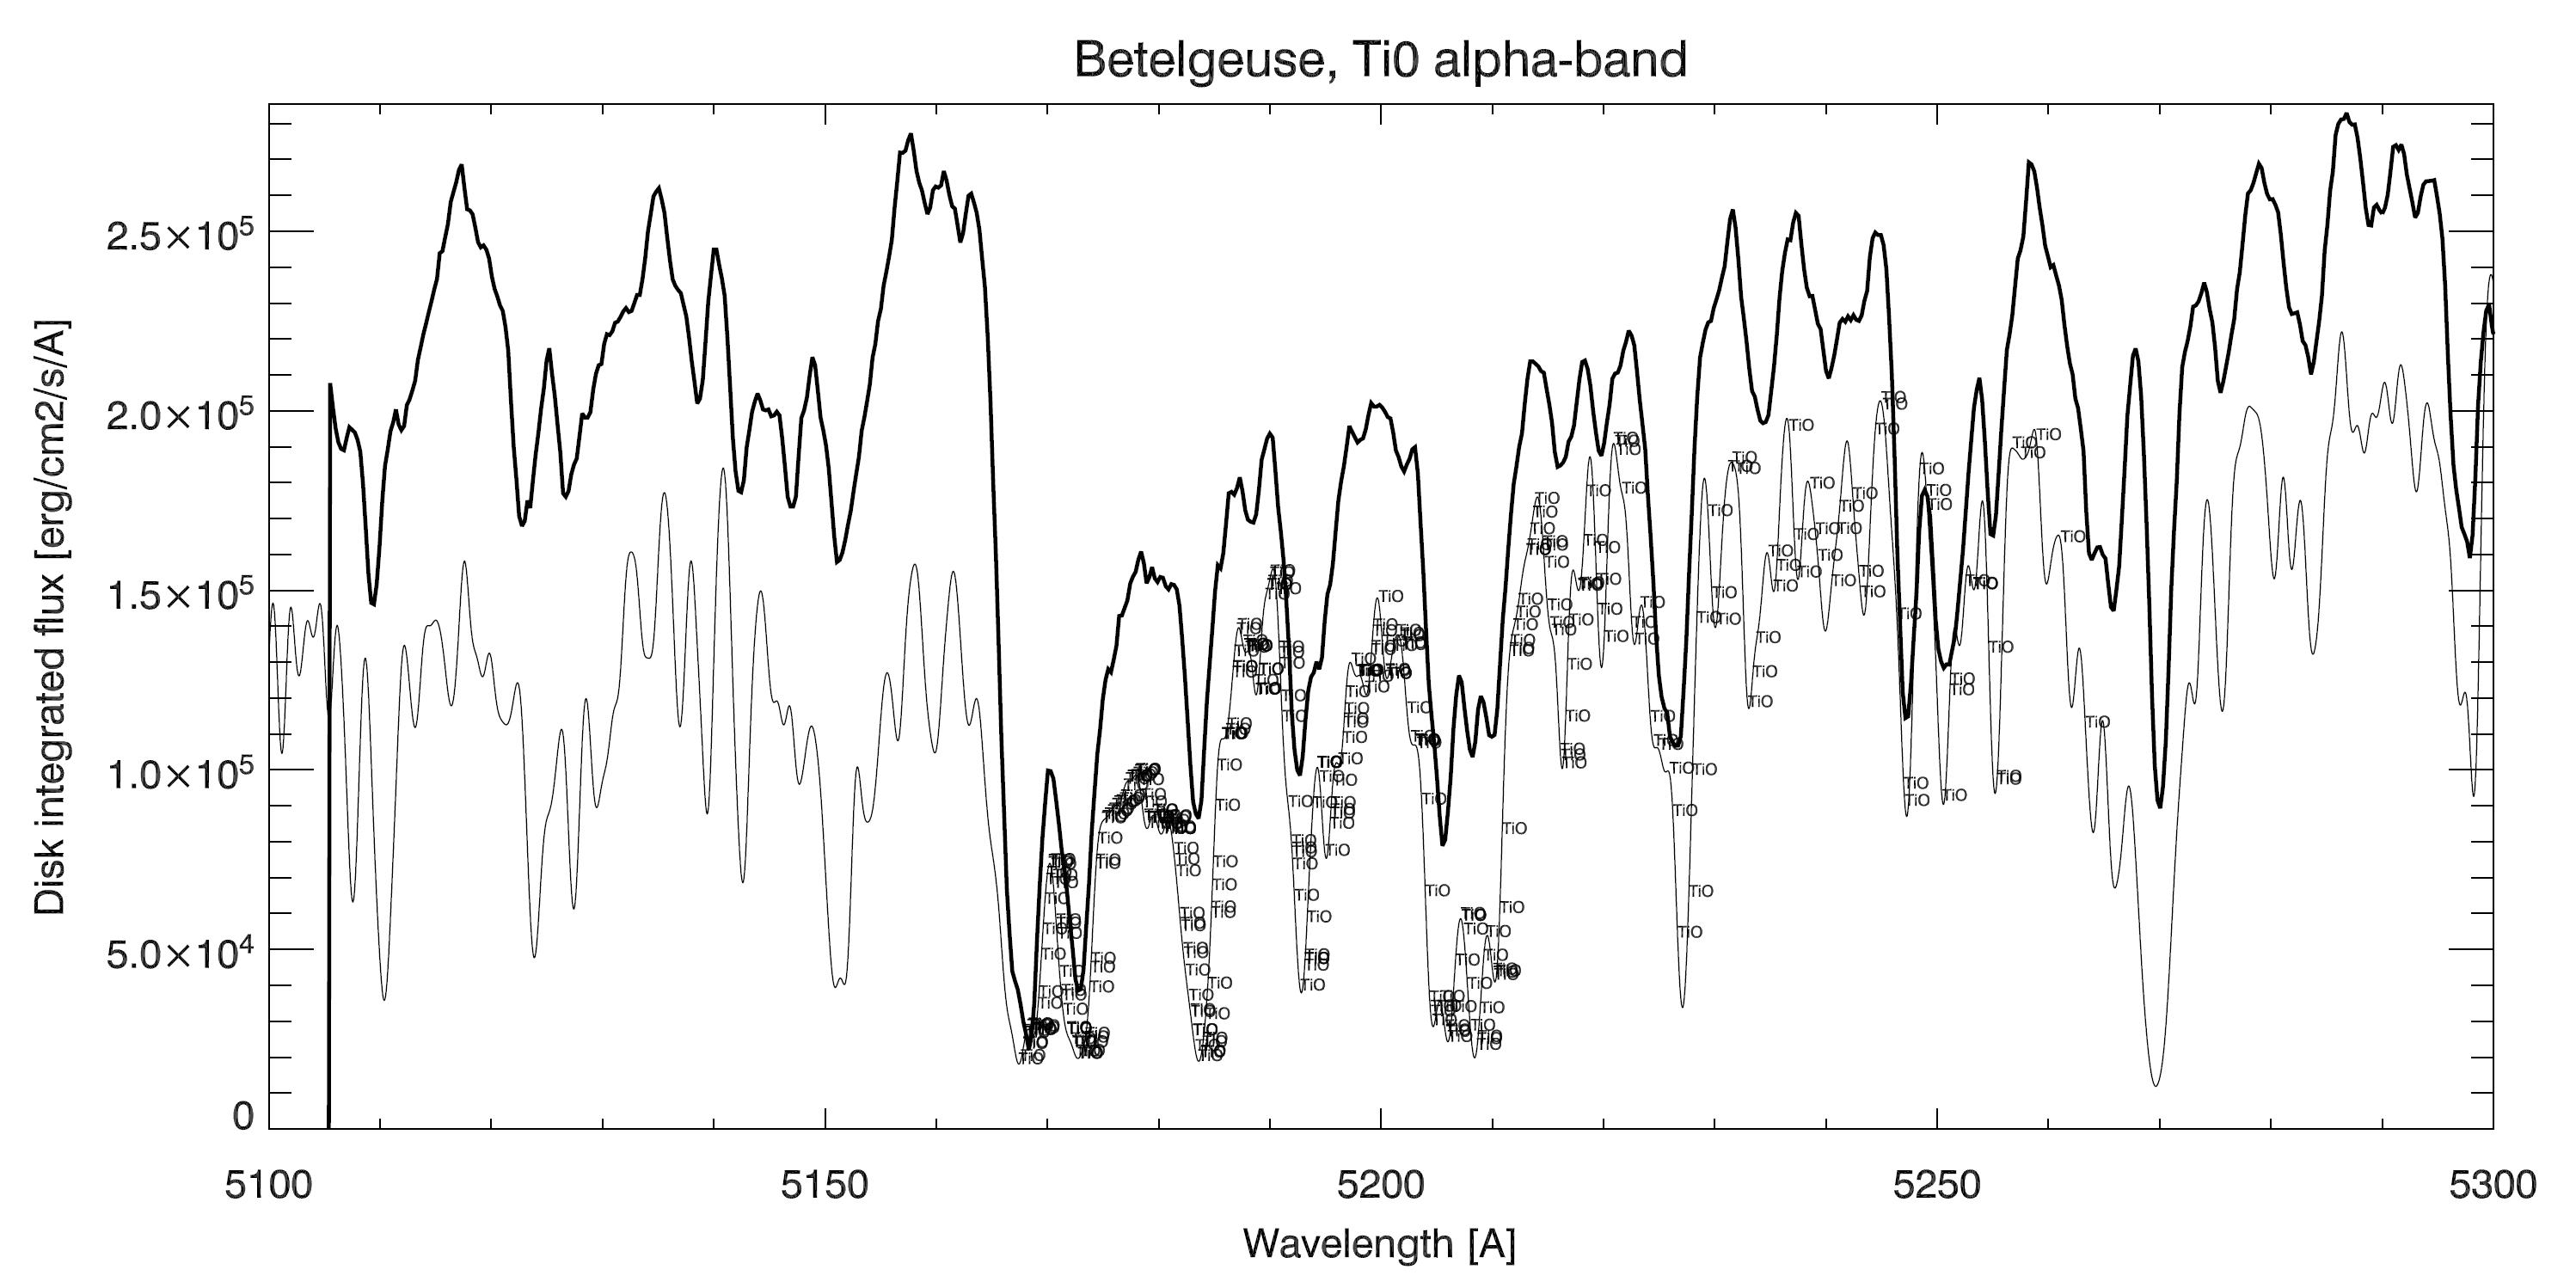
The measurements (thick line) compared with a computed spectrum using the Kurucz Atlas 12 model ap03t3500gm05kvd of Betelgeuse, and the SPECTRUM code with the cool6.iso.lst line list, kindly provided by prof. Richard Grey. The modeled spectrum has been smoothed by a Gaussian of width 1A to emulate the spectrograph response. A microturbulent velocity of 1 km/s was used throughout the atmosphere, which may be a bit small. This line list includes a host of tranisions for the Titanium Oxide molecule, in addition to the other elements that are included in the shorter list luke.lst. The TiO transitions are labeled in a subset of the wavelength range, and for those lines that have equivalent widths greater than 30 milli-Angstroms. Use Ctrl +/- to zoom in on regions in the spectrum. The measured data are shifted up by an arbitrary amount, and they are uncalibrated in intensity. The similarities between theory/model and data are remarkable, I think.
NOTE: The SPECTRUM code adopts plane parallel geometry, and one can argue that this is not suitable for the extended atmosphere of Betelgeuse. Still, the model represents the measured spectral features quite well. However, the magnitude of the overall jump over the "TiO-edge" at 5165 Anstroms is not represented very well, although the data are uncalibrated but this should not have a dramatic effect in this short wavelength interval. If this jump is captured by a spherical model is unclear at the moment. Another aspect is the time variability of the atmosphere of Betelgeuse, and this may play a role? Yet another aspect could be NLTE effects that may be important in such a dilute atmosphere.
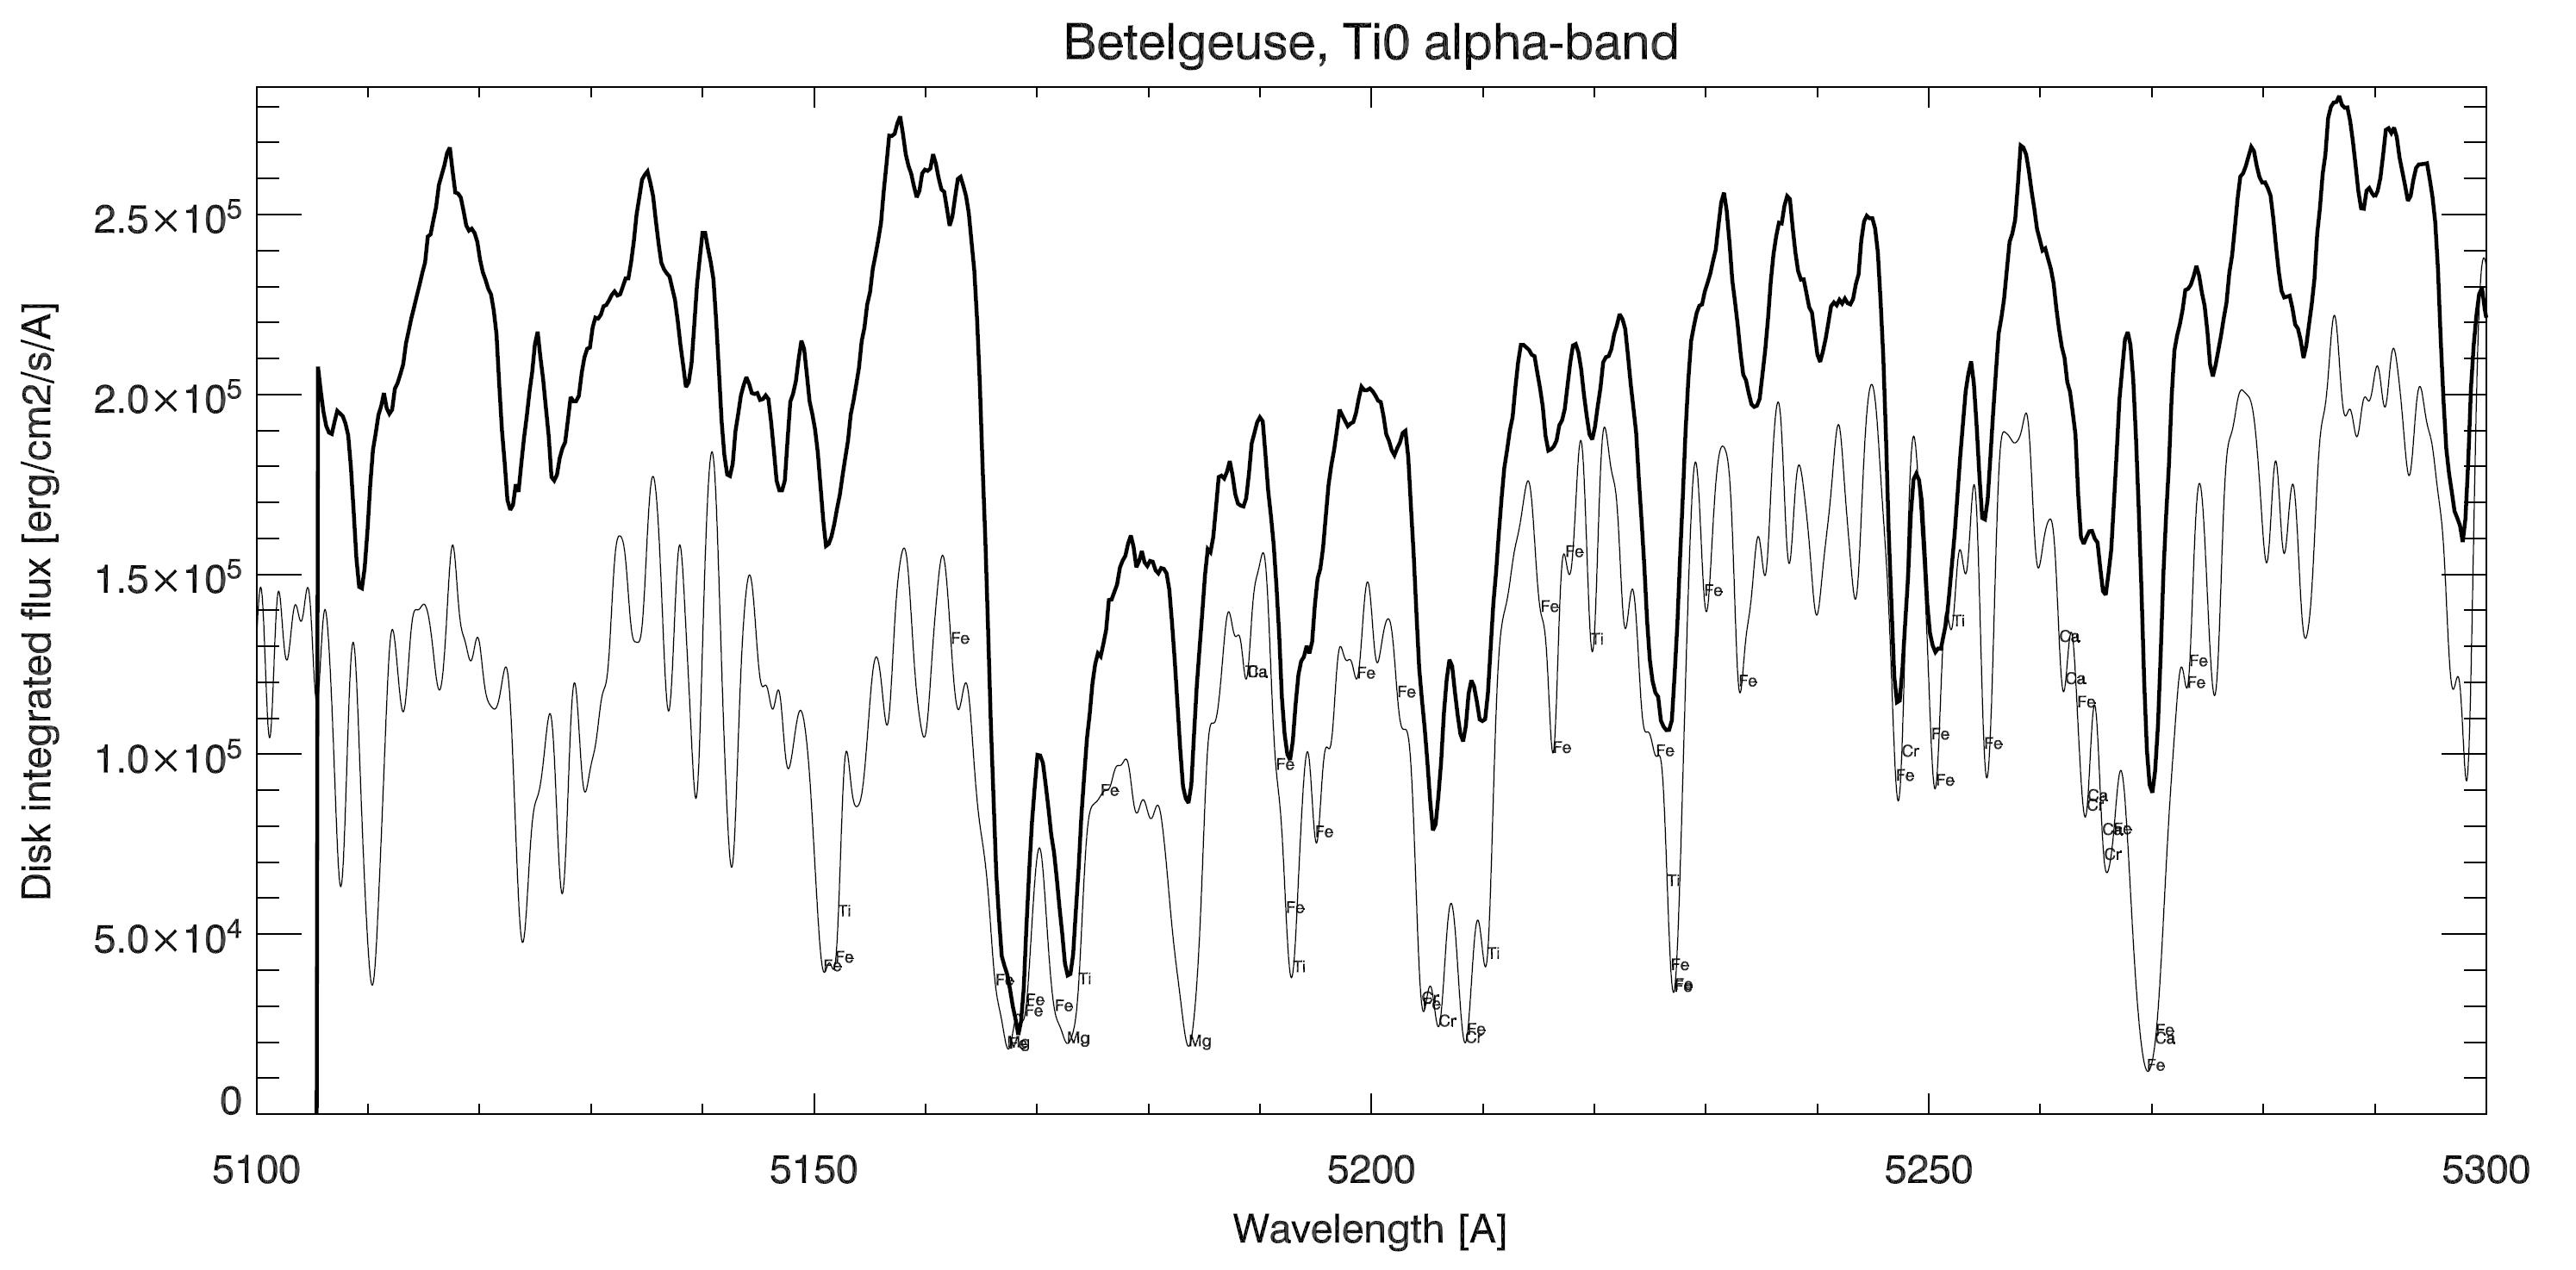 Same spectrum, but lines from other elements than TiO are labeled, if their equivalent widths greater than 150 milli-Angstroms. Use Ctrl +/- to zoom in on regions in the spectrum. It is clear that with this "limited" spectrograph resolution of about 1A, most of the lines become blends between a host of elements, and TiO lines. Stong lines from other elements include Mg, Fe, Cl, Cr, Ca, Ti, among others. The "TiO-band" is therefore a complex mix of lines mostly from the heavier elements.
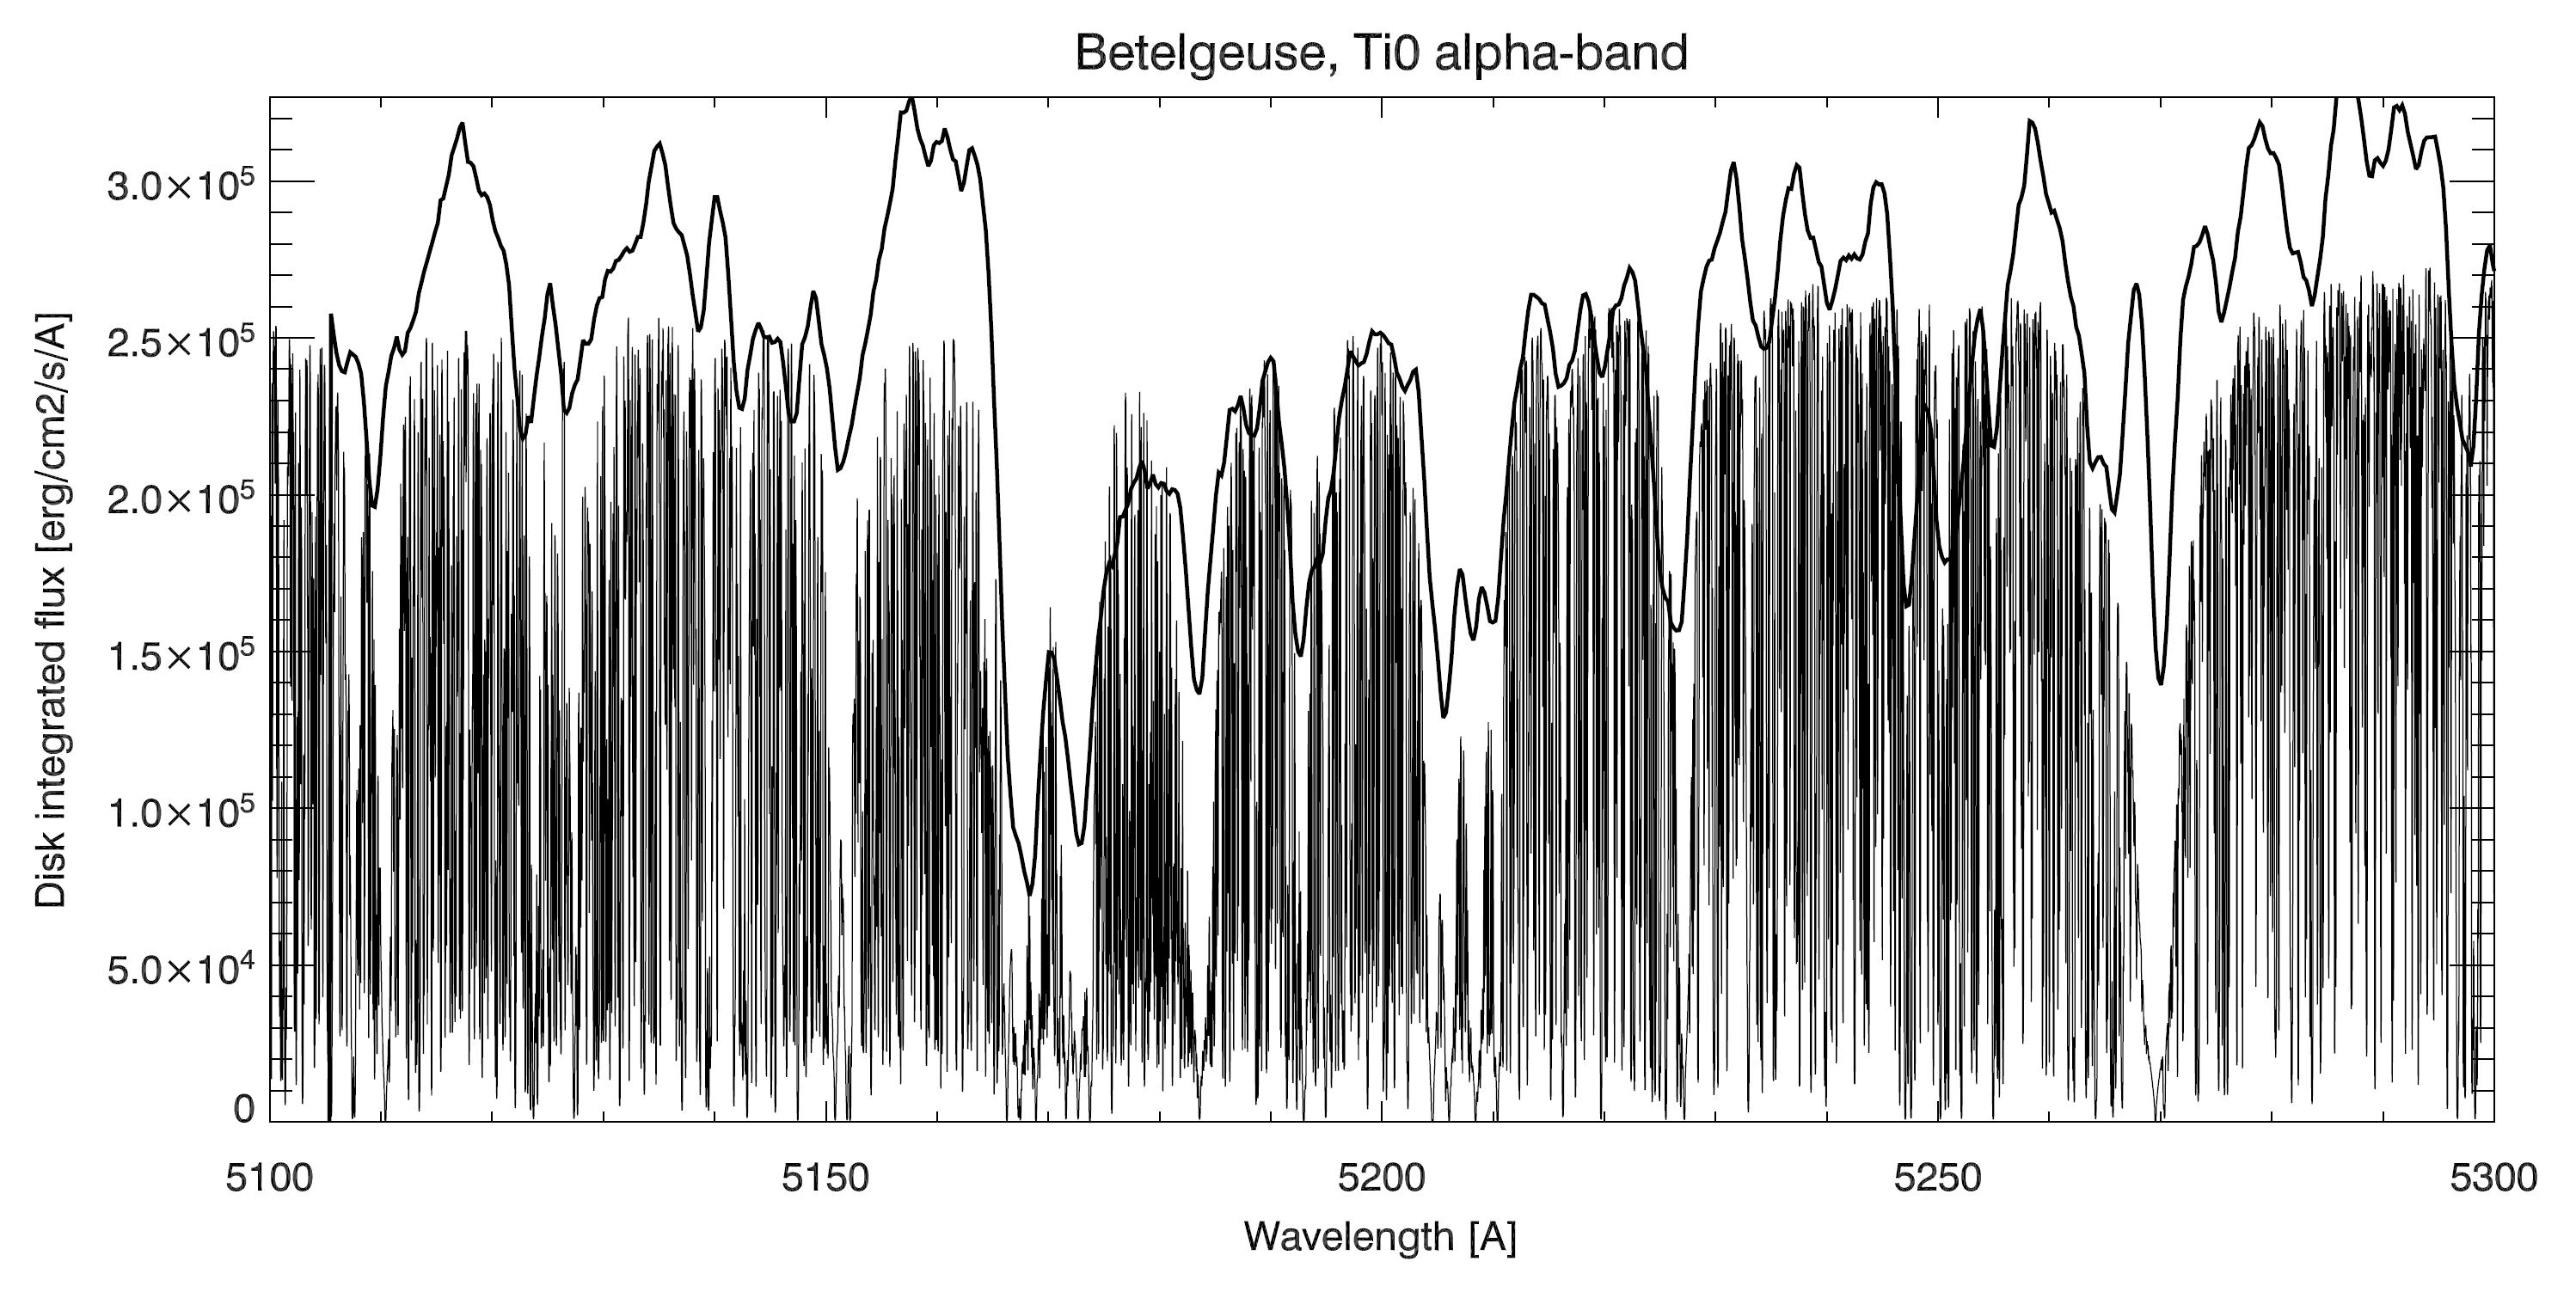 Finally, this is the unsmoothed model spectrum, representing "infinite" resolution, showing a dense jungle of lines! Clearly, the observed data (thick line) represents only a blurred version of reality.