Jupiter's rotational Doppler-shift captured!
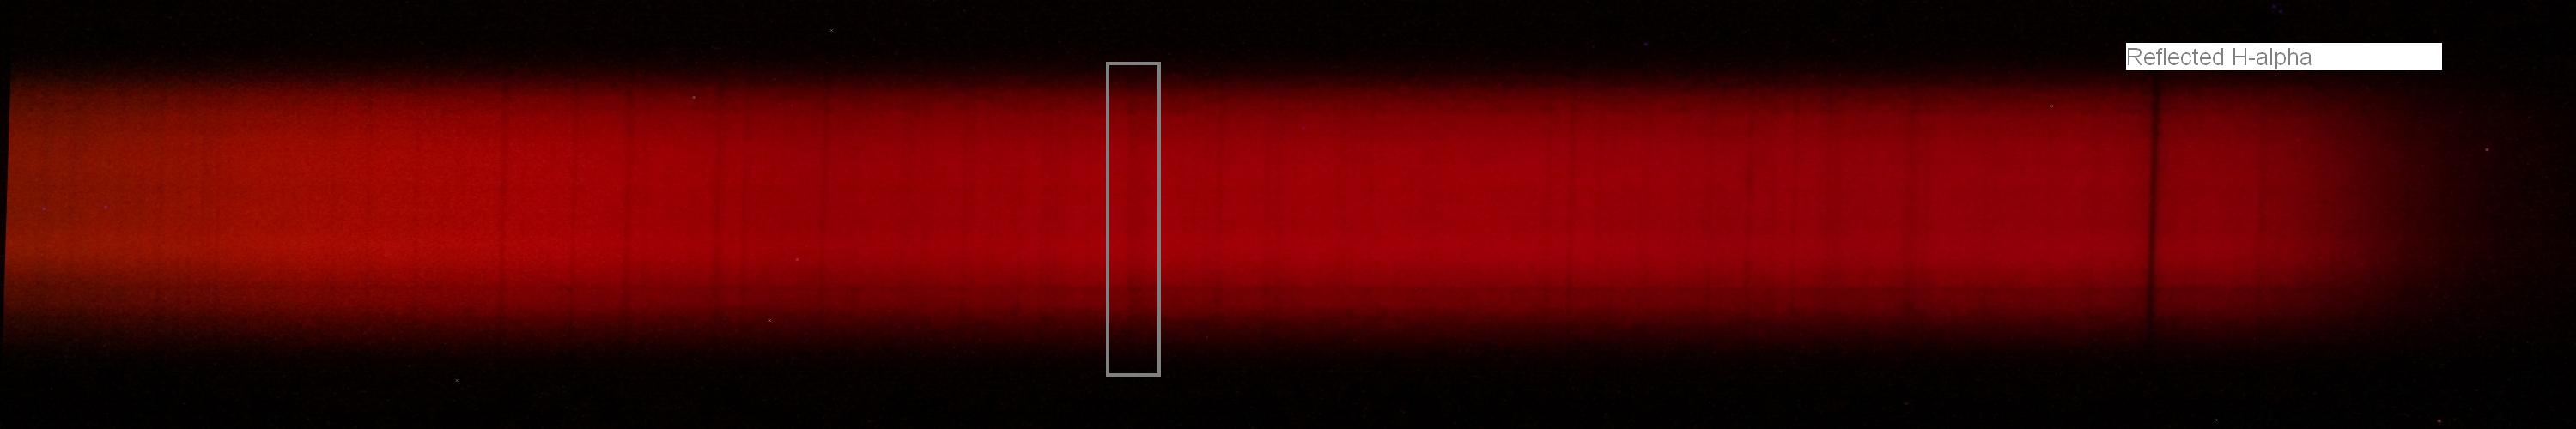
A part of the spectrum from Jupiter. Most of the lines are solar in terms of reflected sunlight. The boxed line is absorption by O2 in the Earth's atmosphere (a Telluric line at 6277 Angstroms). This is used as a reference and the spectrum is corrected so that this line becomes vertical (correcting for tilt due to optical distortions in the spectrograph lenses). This reference represents zero Doppler shift. The other lines are reflected solar lines and the Doppler shift is clearly seen as slanted lines due to the rotation of Jupiter. The slit was oriented along Jupiters equator, and the solar Hydrogen alpha line (reflected by Jupiter) was used to measure how fast jupiter is rotating at the equator (the H-alpha line is the strongest line and its labeled). Canon 450D camera, 1200 lines/mm grating, 16 inch f/10 Schmidt-Cassegrain. March 2013.
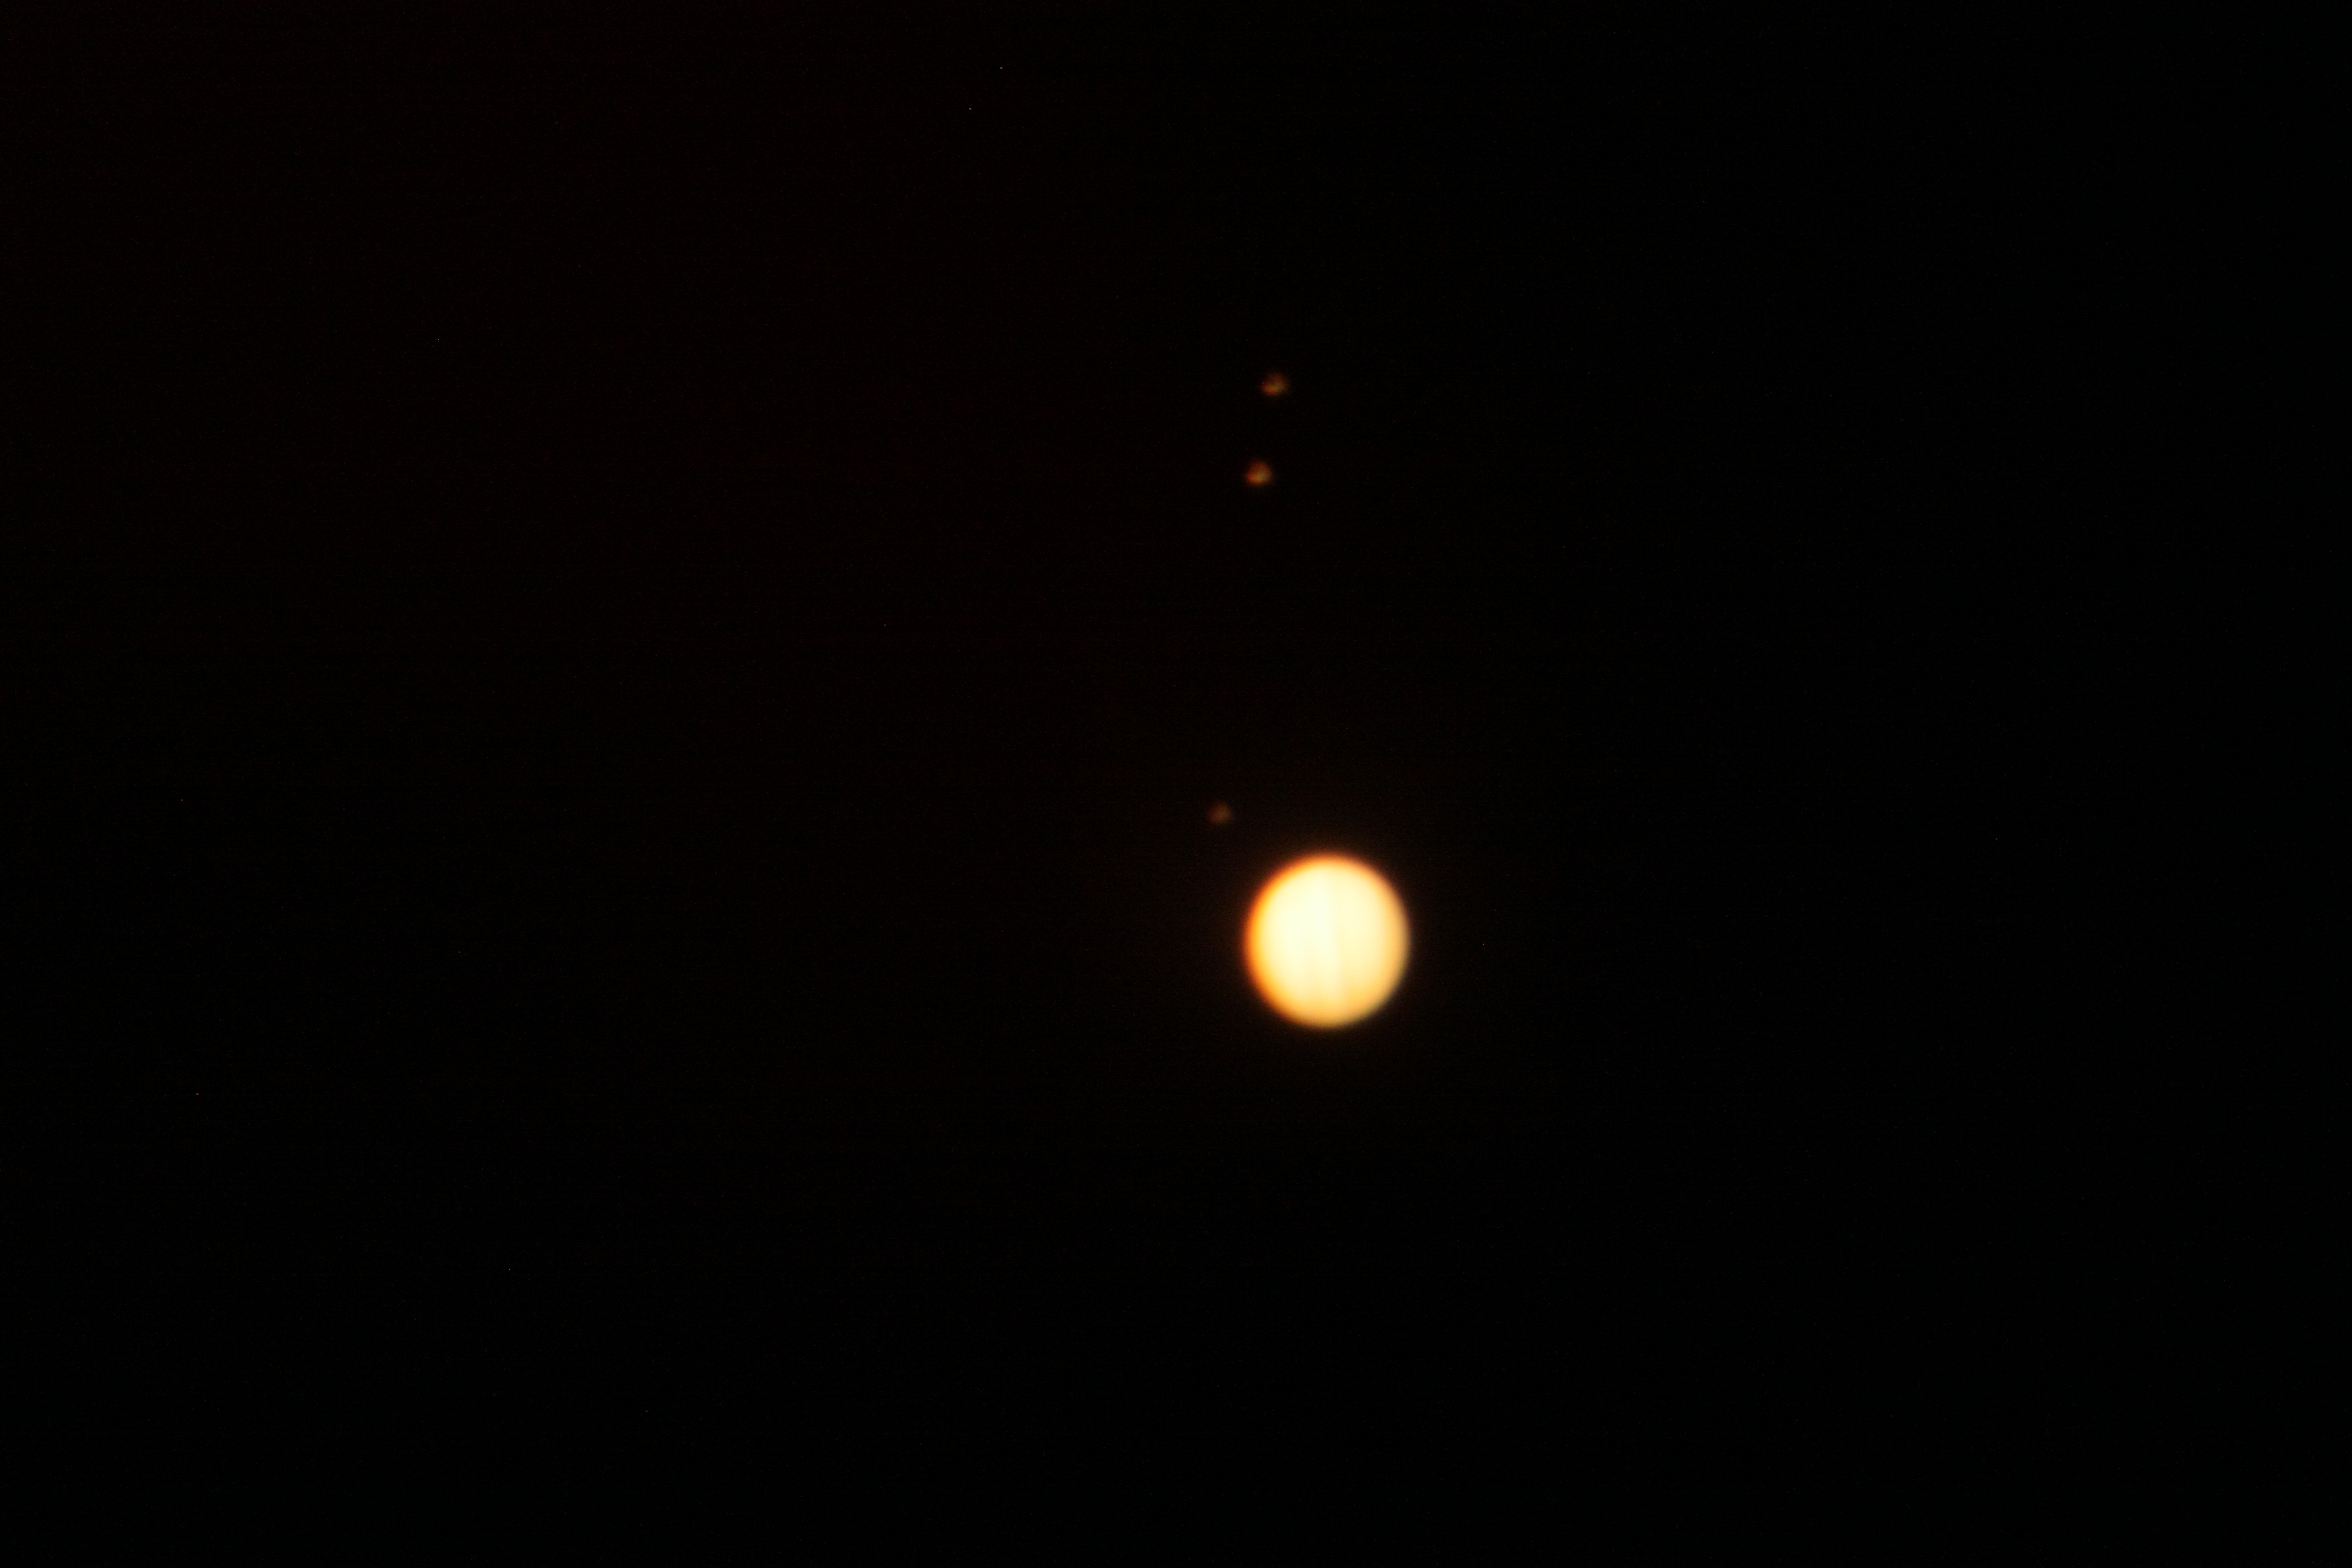
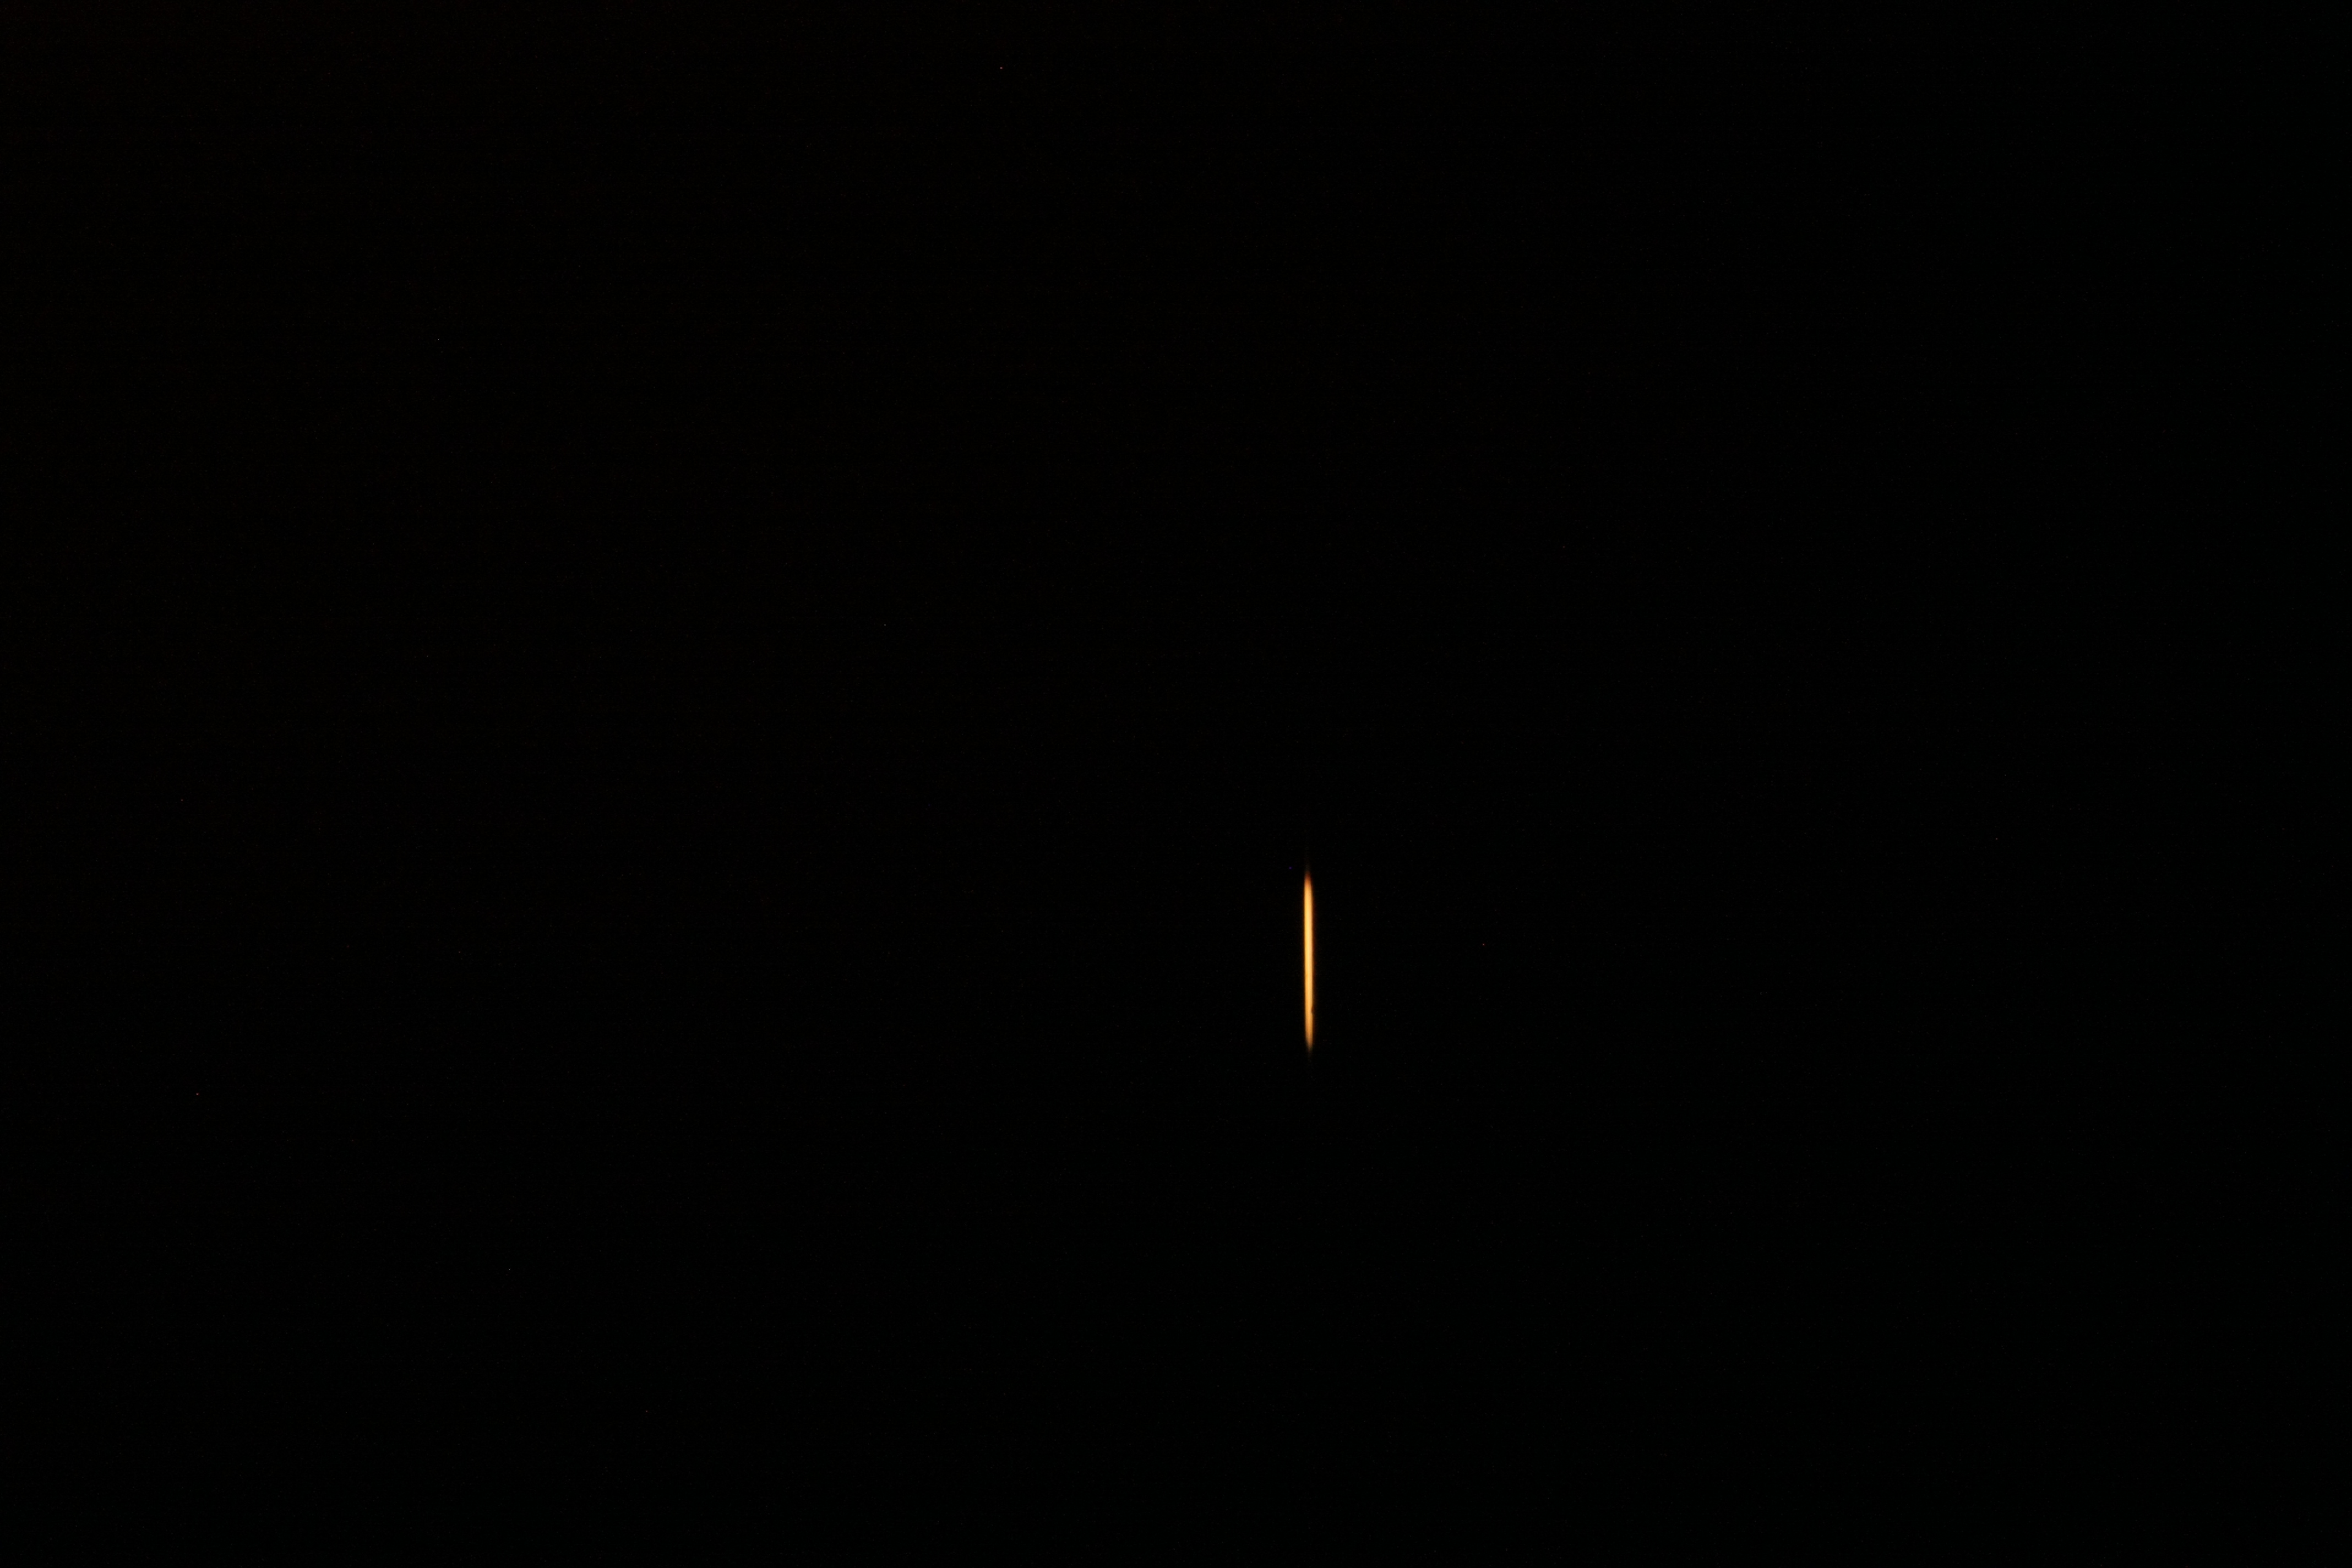
The left image is the zero order image through the spectrograph. The right hand image is when the slit has been adjusted to generate the narrow lines above. The slit is oriented along the equator to capture maximum rotational Doppler shift.
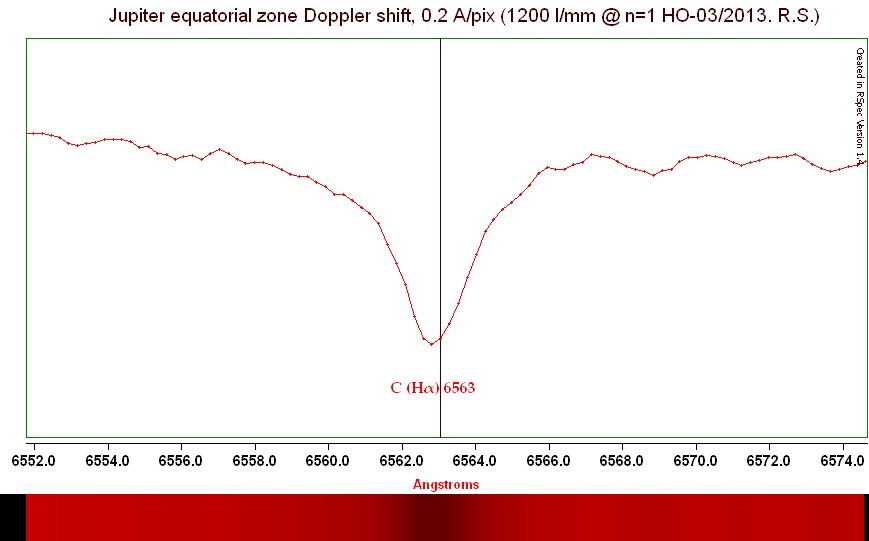
The Hydrogen alpha line on the west limb (the lower part of the spectrum above) is slightly blueshifted with motion towards us.
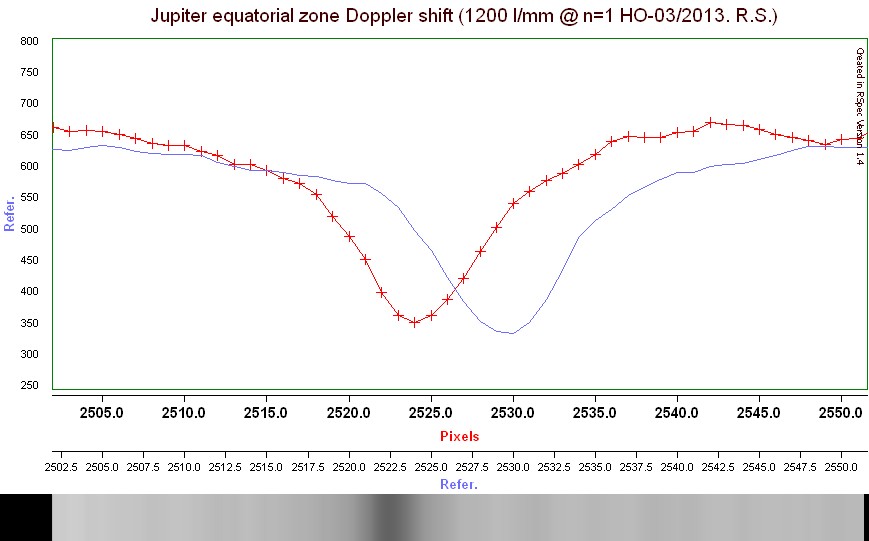
West and east limb Hydrogen alpha lines shown together, displaying a clear relative Doppler shift. The Doppler shift between the east and west limb measures about 5 pixels,
and at 0.2 A/pix this is about 1 Angstrom or 0.1 nm. The total rotational velocity corresponds to half of that.
Estimating the rotational velocity and diameter of Jupiter
Now comes the tricky part: The H-alpha line arrives at the receding limb redshifted as seen from Jupiter. This is light is then reflected back towards Earth, but the limb is receding, so the line arrives redshifted TWICE, at Earth. So the estimate of the equatorial rotation velocity of Jupiters upper atmosphere is V= (0.05 nm / H-alpha wavelength) * velocity of light = 11.4 km/s.
This can be checked: The rotational period is 9.84h at the equator, established
by simply following the features in the cloud layer. The diameter of Jupiter is then estimated at D=V*P/pi = 128900 km.
This is not bad, since the actual value is about 142984 km, and we are only 10% in error, on the low side. Anyway, the layer where the H-alpha line is reflected could be lower than what corresponds to the definition of Jupiters diameter, but 10 percent is a bit too much.... The measurement could have been improved by more sophisticated techniques for measuring the line shift and by performing noise reduction techniques, or by using even larger dispersion.
Methane and Ammonia in Jupiters atmosphere: Confirmed!
The spectra above also contains other interesting details about Jupiter. An extented spectrum is shown below using the 600 mm/l grating:
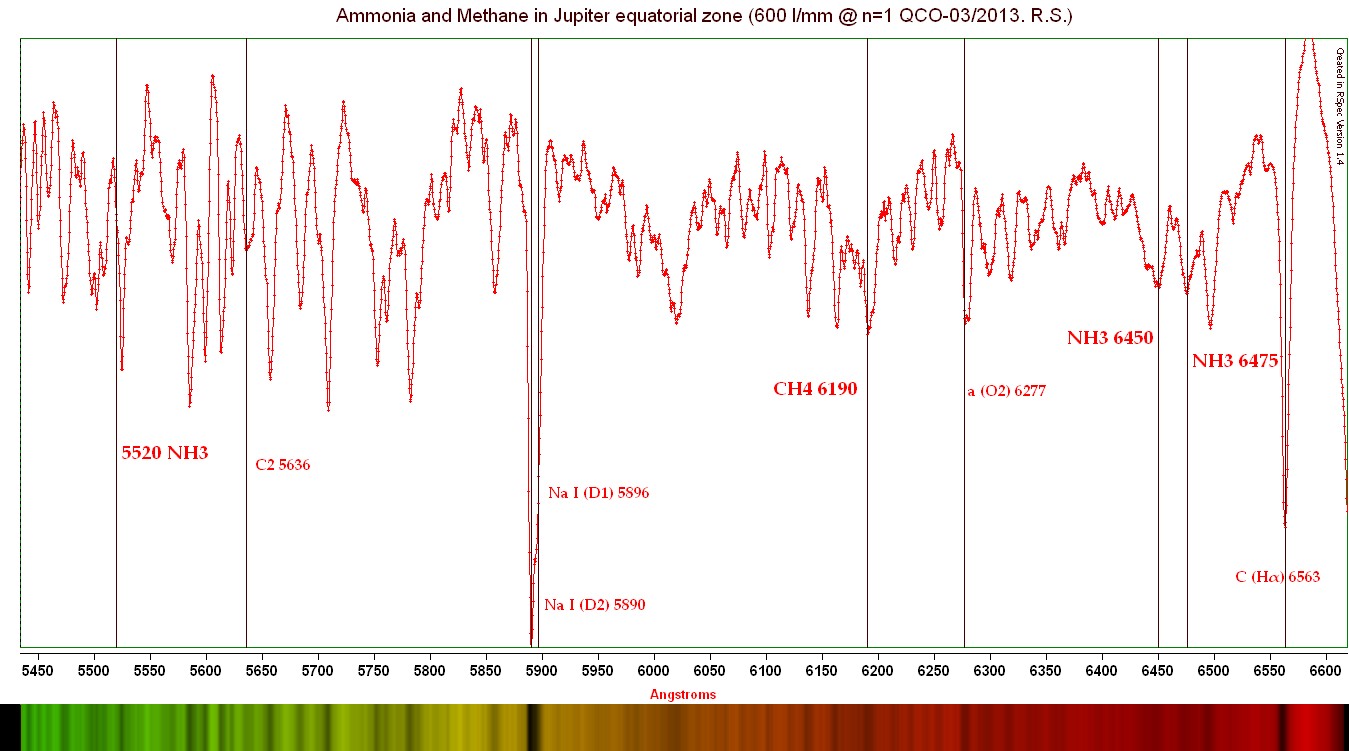
Ammonia and Methane (NH3 and CH4) in Jupiters atmosphere is seen as molecular absorption bands. Most of the spectral lines are just reflected sunlight, and the sodium line (Fraunhofer D1 and D2 are pronounced). Home made QCSPEC with the 600 l/mm reflective grating, narrow slit, and a Canon 450D camera, 10 inch f/6 Newtonian. March 2013.