Some portions of the solar spectrum
LTE modelling using Kurucz solar models and extensions thereof.
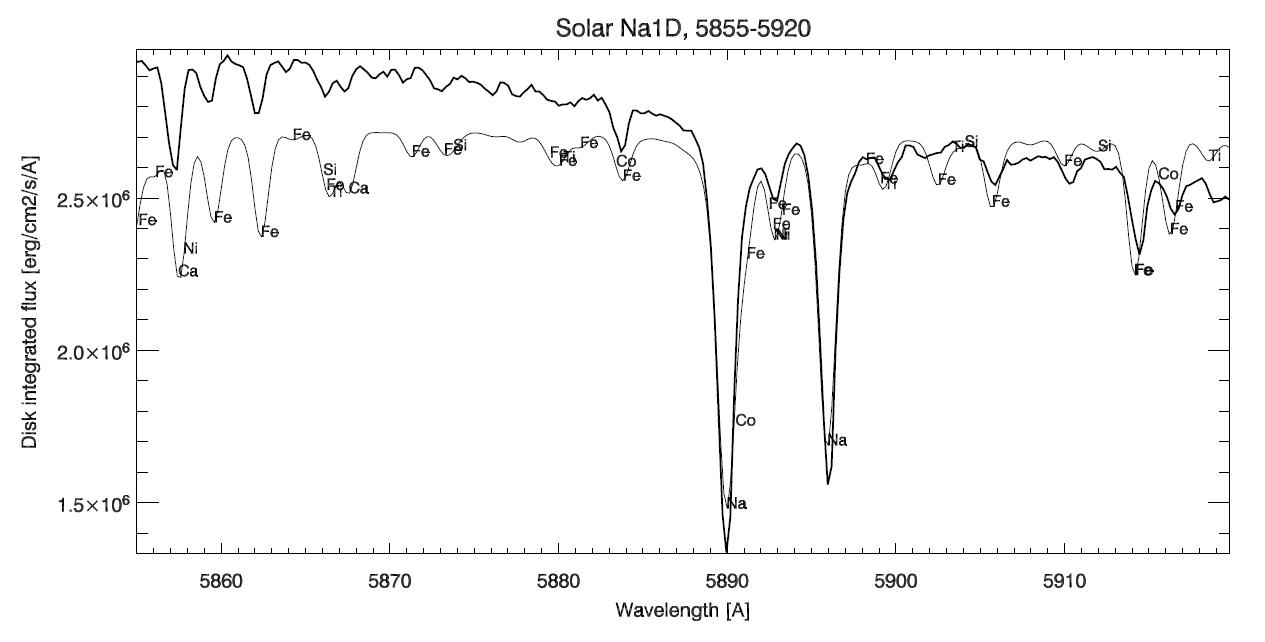
My first comparison between a smeared spectrum from a Solar model (the sun.mod model from R. O. Grey's SPECTRUM website) and data from the home made spectrograph. Thick line: The sodium doublet at 1200 lines/mm grating, at first order (n=1).
Thin line: smoothed model spectrum (assuming Gaussian instrument smearing) at an effective resolution of only 1A, which seems to fit better than the estimate of 2A, using calibtation lamps. A 2 km/s microturbulence was assumed (although 1.0 - 1.5 m/s is adopted in some solar models). The elements are indicated, and the conclusion is that nearly all the wiggles in the observed spectrum is real, and not influenced too much by instrument noise
(thrilling, indeed!). The sunlight entered the slit directly (no additional optics), and the observed spectrum was only calibrated in wavelength, and not for spectral sensitivity of the instrument (a Canon 450D (Rebel XSI) plus the response of the lens glass and vignetting). Therefore, we see an artificial background slope in the observations (trend in the thick line).
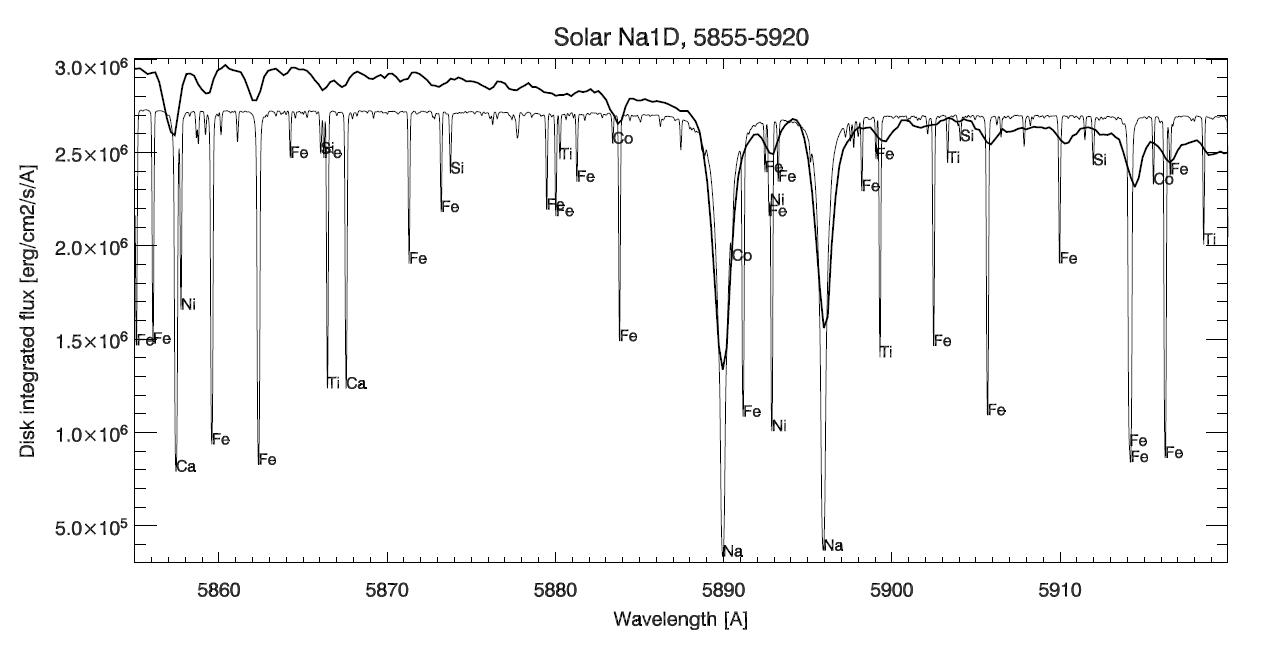
Same, but unsmoothed model spectrum (from the sun.mod model), which shows the resolved spectral lines from a host of elements, up to iron and beyond. This fact suggests that the sun is leftover supernova-stuff! Here, we see that the weak spectral lines are not captured by the spectrograph at this moderate resolution, but the stronger ones come out as significant depressions, sometimes as a blend of adjacent lines incliding iron lines.
We see that the Sodium lines (Na) are well resolved, to the extent that the solar abundance can be measured (!), using the integrated area of the line profile (or the equivalent width).
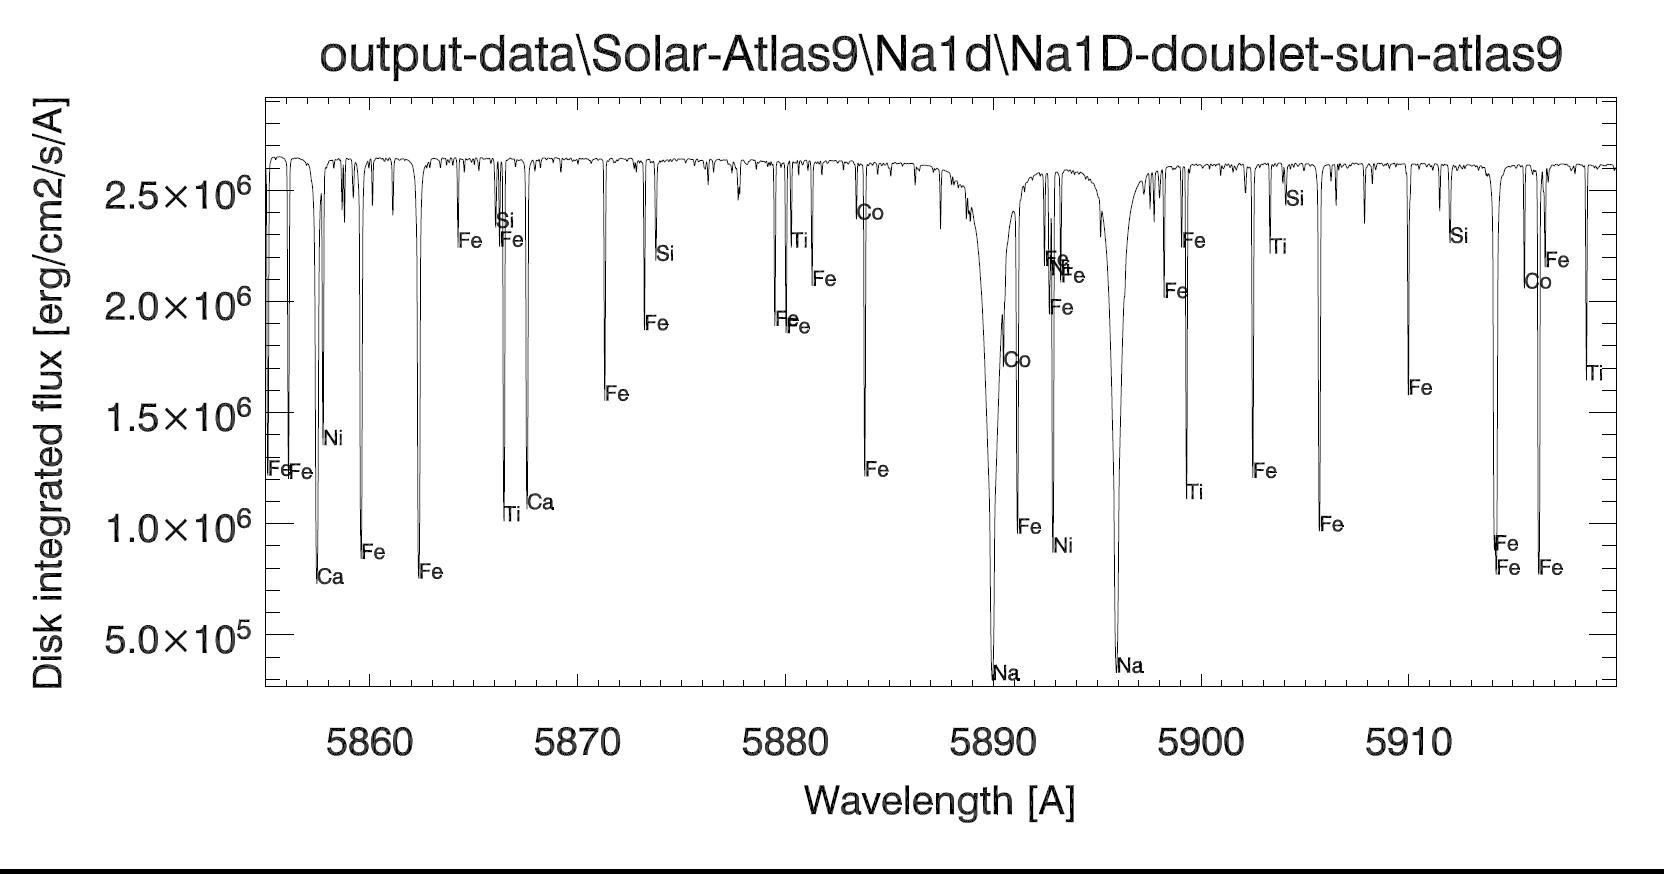
Sodium lines in the Atlas9 model by R. L. Kurucz and F. Castelli. Thin line: Unsmoothed model spectrum, which shows the resolved spectral lines from a host of elements. A 1.5 km/s microturbulence was adopted. The elements are indicated. A slight alteration of the temperatue and density profiles in the atmosphere changes the spectral lines only slightly, with e.g., somewhat deeper Sodium lines.
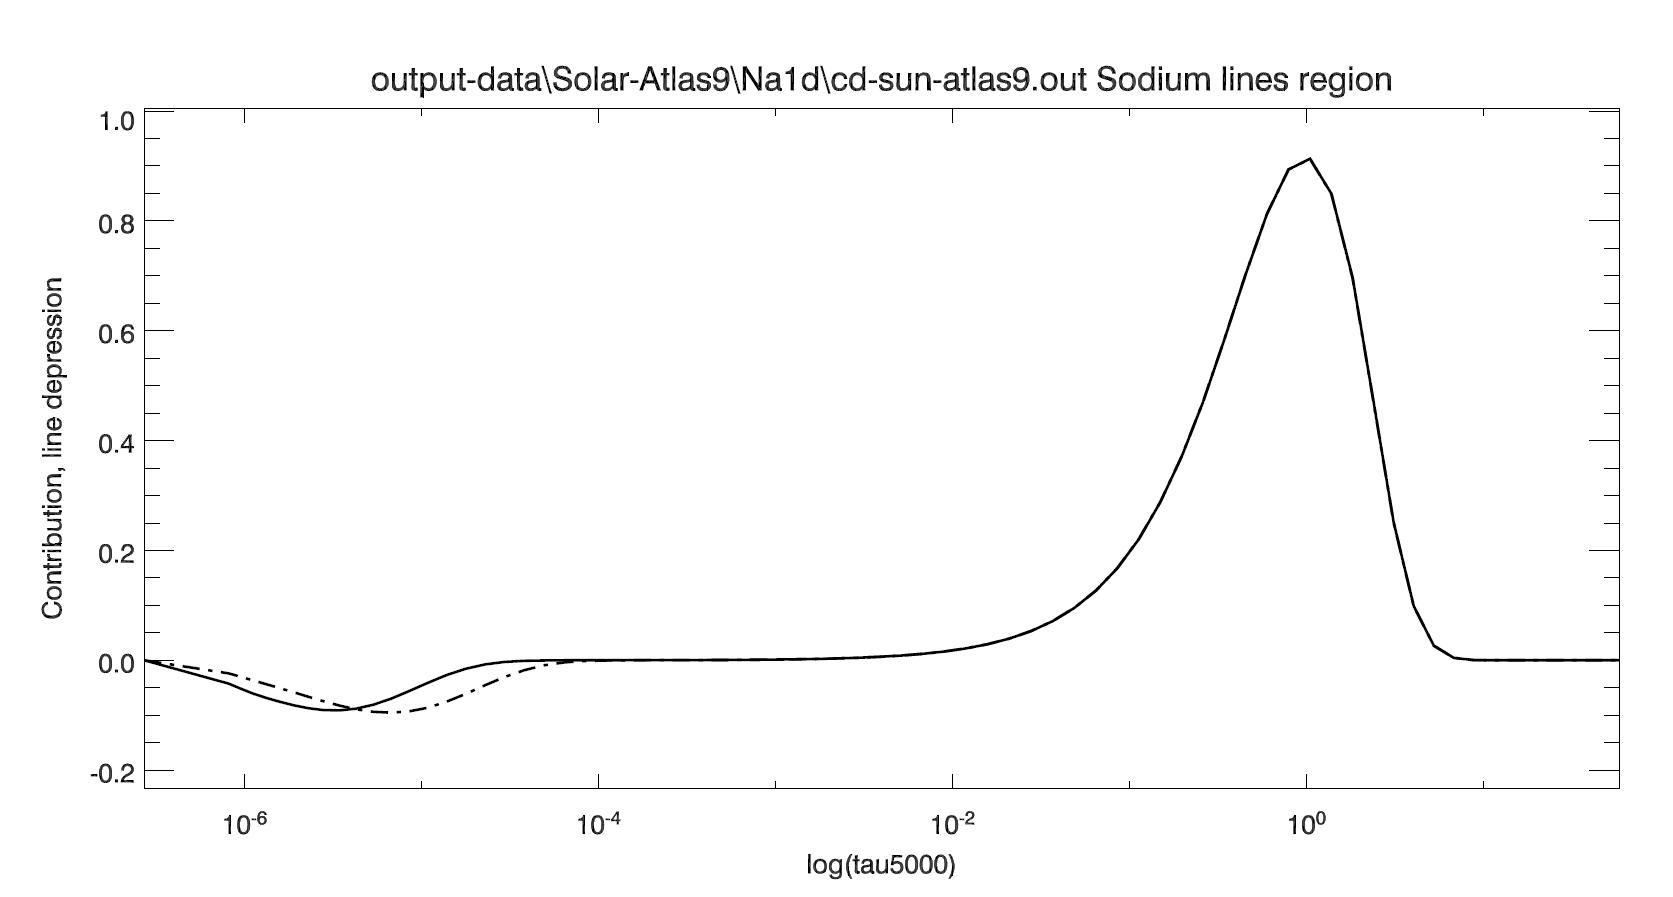
Contribution function "Cd" to the line depression D=[I(continuum) - I(line)]/I(continuum) for the central cores of the Sodium lines in the Atlas9 model. Full line: 5889.9 line, Dashed line: 5895.9 line. The integral of Cd over the optical depth scale (tau5000) gives the total line depression D at the center of the line. The positive deep part of Cd (at about unity optical depth at 5000 A) represents the continuum forming layers in the far wings of the Sodium lines (depths where the photons in the neraby continuum escape). The negative part (at low optical depth to the left) represents the line forming layers in the central core of the Sodium lines higher up in the atmosphere (these are the depths where the photons in the line core escape). The negative sign comes from the subtraction -I(line), by definition. LTE is assumed, and this may be (or is) inaccurate for the core regions of the stronger lines that are formed in the upper dilute layers of the atmosphere where non-LTE effects usually set in (deviations from local thermodynamic equilibrium / LTE).
Magnesium lines
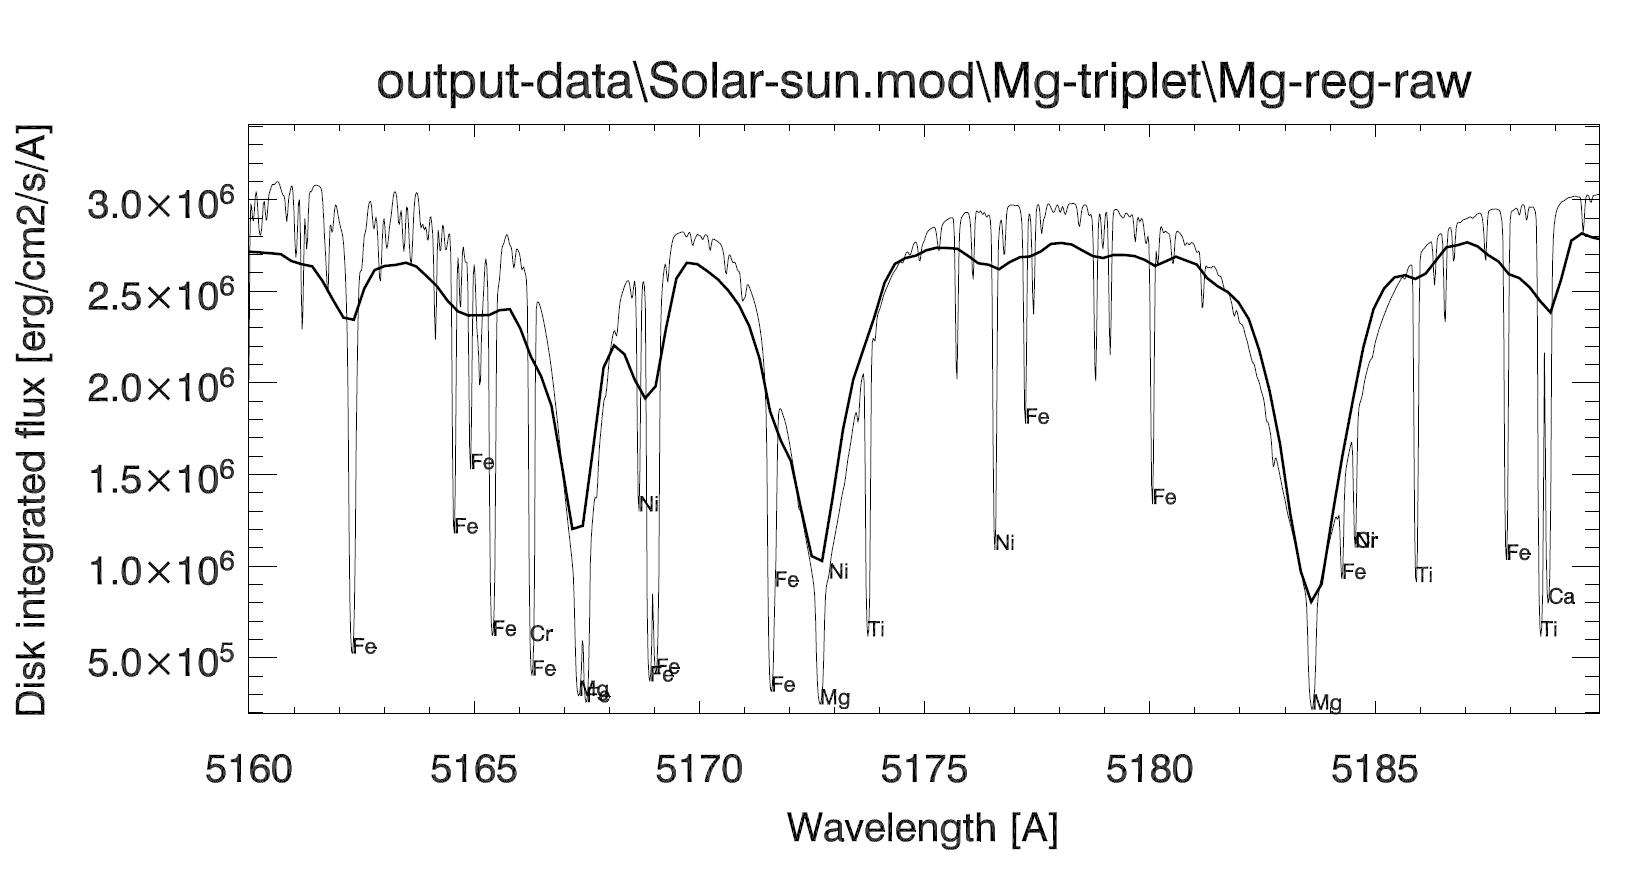
Magnesium triplet in the "sun.mod" model. Thin line: Unsmoothed model spectrum, which shows the resolved spectral lines from a host of elements. A 1.5 km/s microturbulence was adopted. Thick line: Data from near the Magnesium "triplet" in the Solar (disk averaged) spectrum at 1200 lines/mm grating, at first order (n=1). The sunlight entered the slit directly (no additional optics).
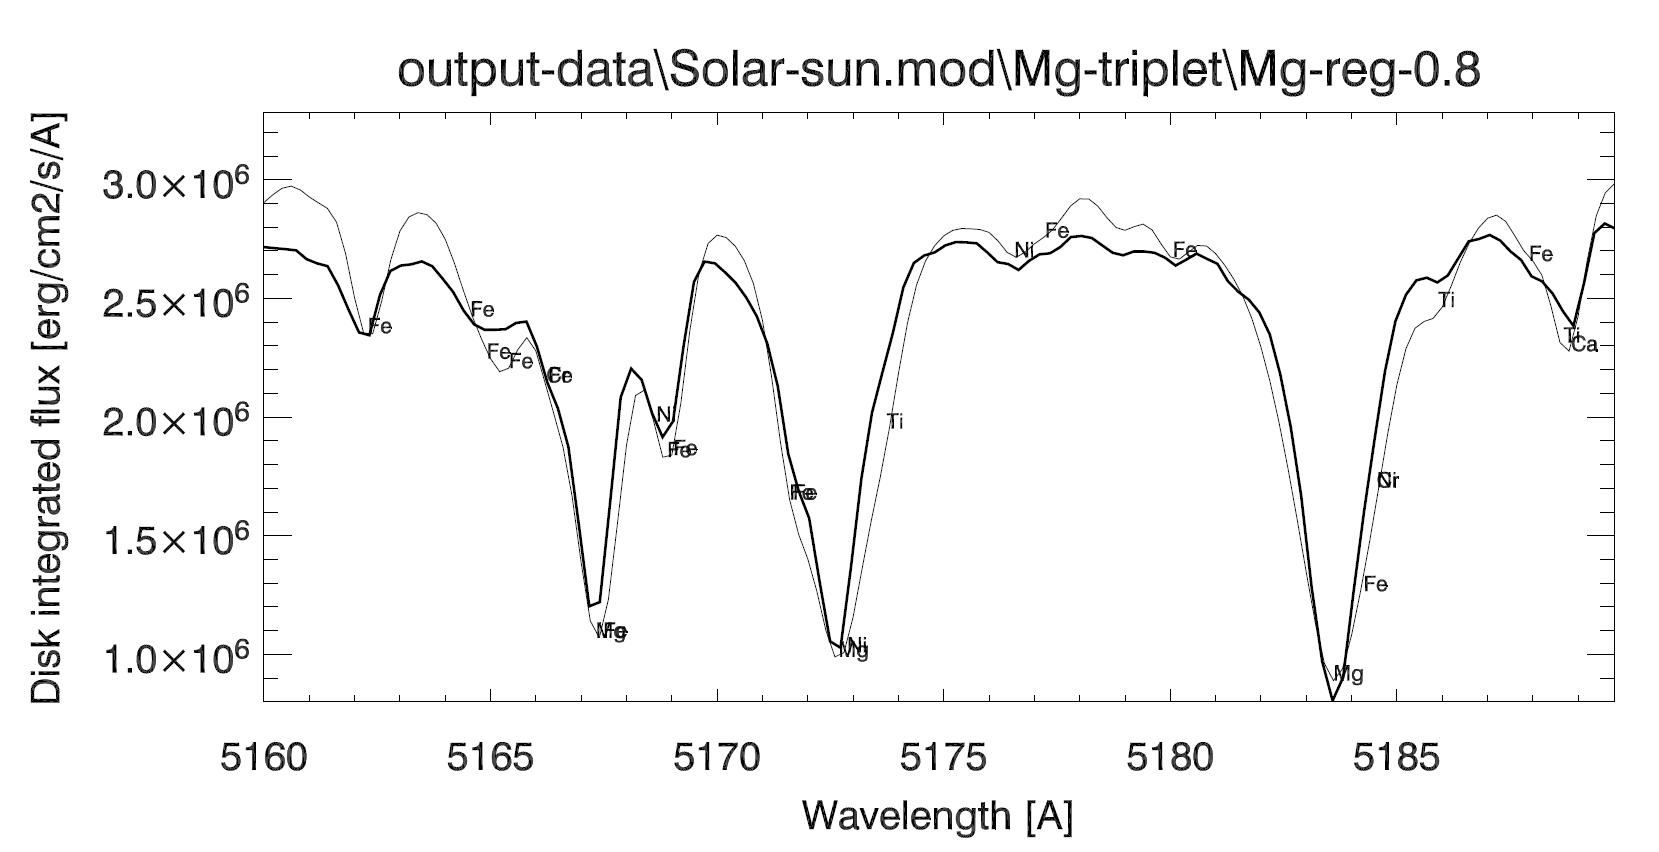
Magnesium triplet in the sun.mod model. Thin line: smoothed model spectrum (assuming Gaussian instrument smearing) at an effective resolution of 0.8 A. A 1.5 km/s microturbulence was adopted. The elements are indicated. Thick line: Same data from near the Magnesium "triplet". Based on this result, the spectrograph resolution was about R = 5000 (while the design criterum was 3000).