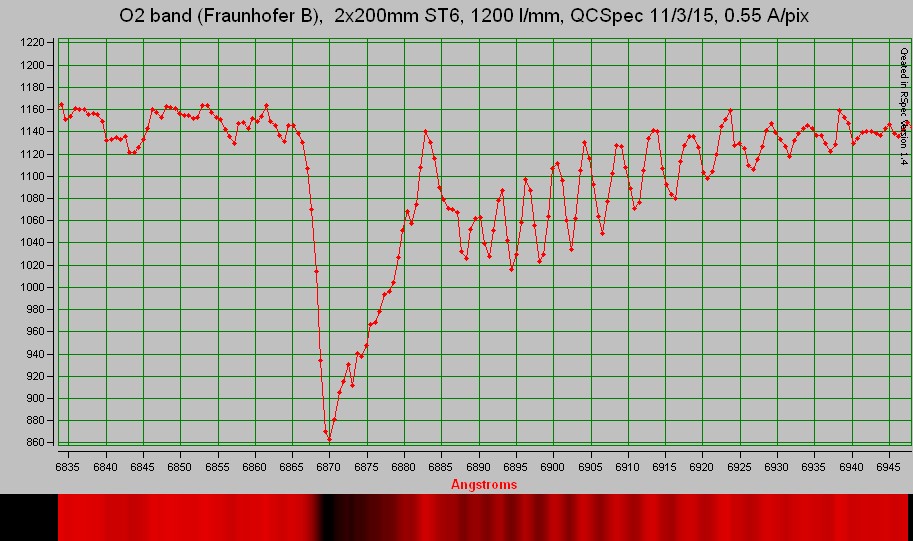
The Fraunhofer B-band from diatomic oxygen (O2)
The red part of any stellar spectrum, beyond Hydrogen alpha, contains the fingerprints of Oxygen and water vapour in the Earths atmosphere. The modelling below amounts to matching the Oxygen B-band to a "stick-plot" of computed line strengths from the HITRAN/GEISA database for molecular spectra. The line strengths were calculated at T=296K.
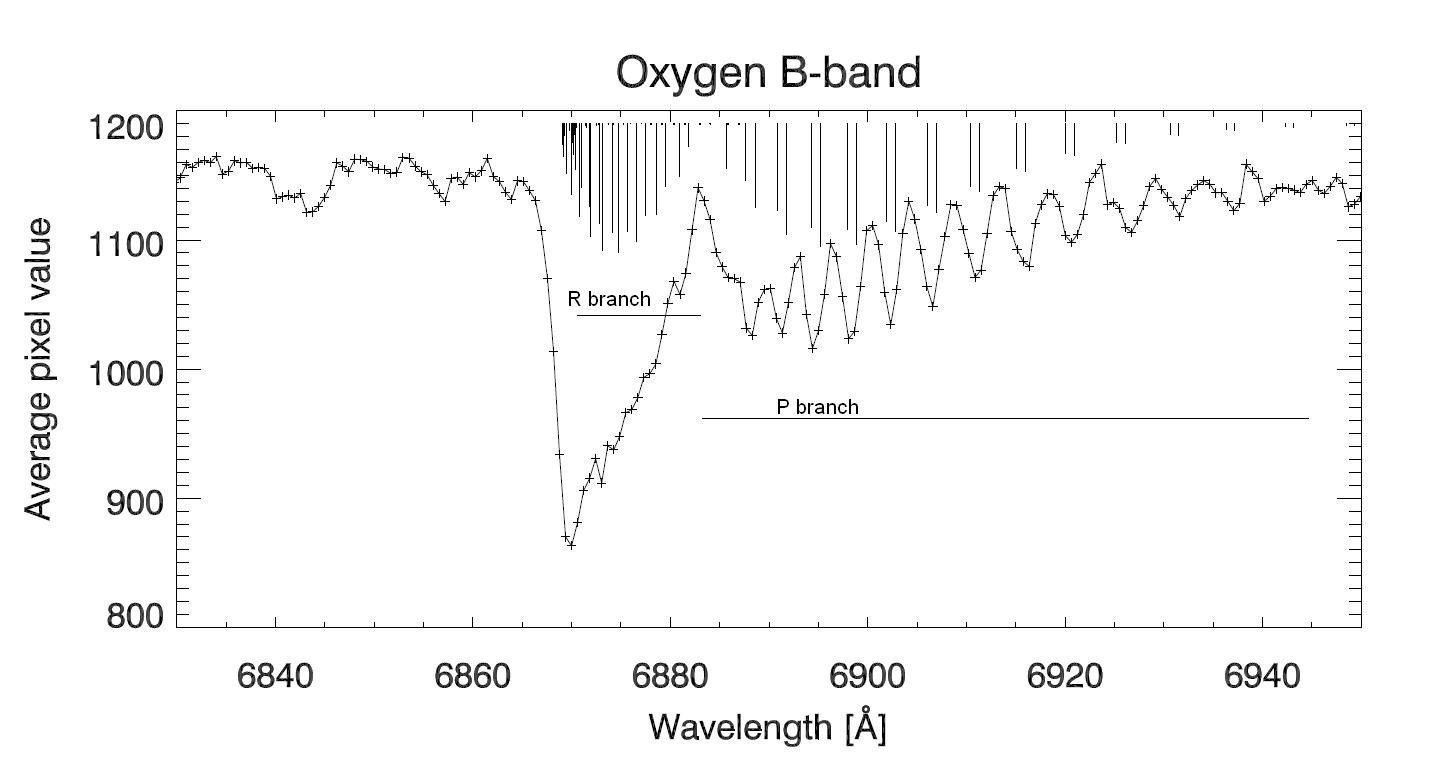
Caption: The spectrum matched with a "stick-plot" of the line strengths from the HITRAN/GEISA database. The blending in the dense R-branch lowers the intensity considerably and forms a band-head. The apparent lines in the extended P-branch are in fact blends of two lines. These lines correspond to the rotational-vibtrational transitions in the molecule. A specific vibration transition determines the general frequency range of this band. A number of simultaneous rotation transitions, which are also discrete, (with rotational quantum numbers changing according to j > j+1 :R-branch, or j > j-1: P-branch), determines the exct energy of each line. The stong intensity peak marks the division between the P and R banches, where the re ar no transitions.
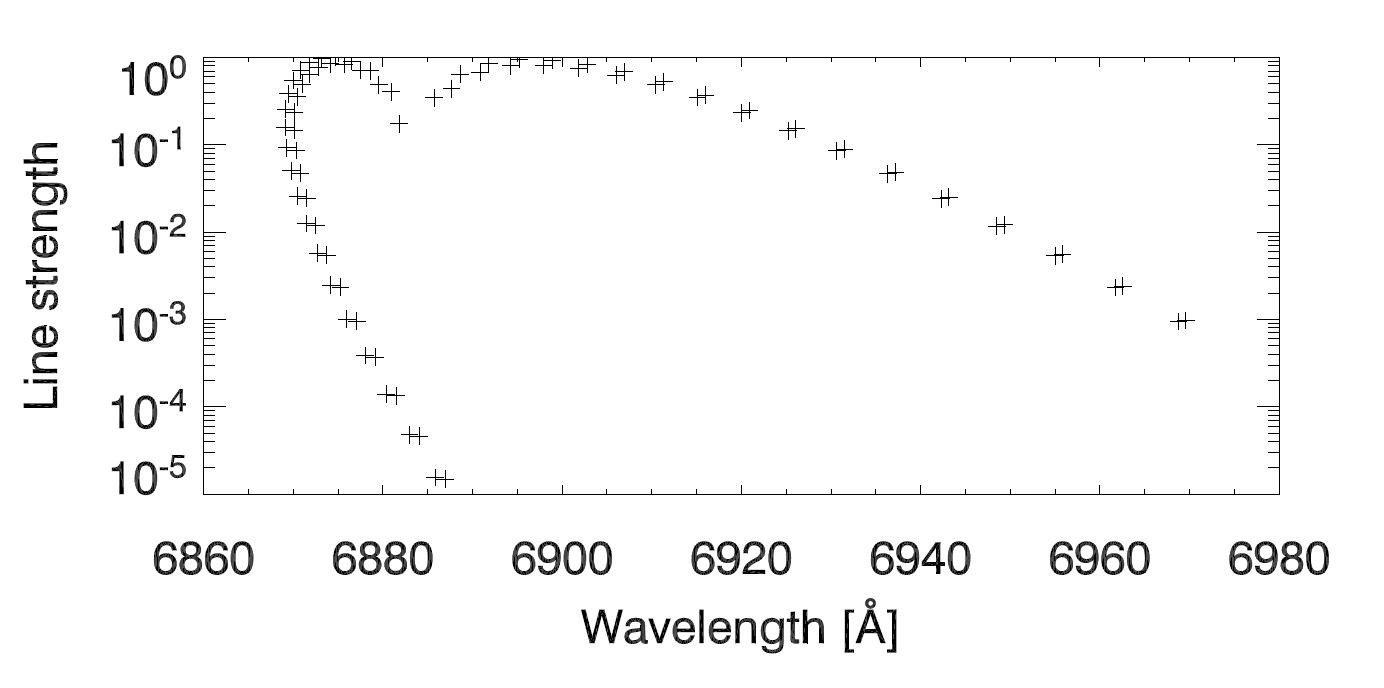
Caption: The line strengths in the spectrum on a logarithmic scale, showing a large number of overlapping weak lines with varying strengths in the R-branch.