Features near the H and K lines of Arcturus, around 400 nm
Arcturus is a K star (a red giant of spectral class K1.5III), and it has moved away from the main sequence. As many other stars, including the Sun, Arcturus has an active and heated chromosphere that gives emission in the strong spectral lines such as the Ca H and K lines in the near ultraviolet, or in the Magnesium lines. Arcturus is relatively metal poor with log[Fe/H]=-0.5 (only 30% of the solar iron to hydrogen ratio). The width of the H and K emissions in the line cores correlates well to the abosolute luninosity measure, as shown by Wilson and Bappu.
The emission in the central core of the H and K lines appears within a window of only about one Angstrom. High resolution is then needed to resolve the emission peaks. Furthermore, Arcuturs is red, so the intensity in the near ultraviolet is relatively low, adding to the lowered CCD sentitivity in this range. This makes such an observation very challenging with home made equipment. A sampling resolution of about 0.6A was used, close to the maximum that could be obtained, but this is quite low resolution for the task. The effective resolution was even lower, at about 1.5 A for the chosen slit opening of 30-40 micrometer. A 2x190mm focal length was used for the spectrograph objective, a grating of 1200 lines per millimeter, and a 10 inch Newtonian. 12 CCD exposures og 90 s each were added, but the noise was significant since the sensitivity of the CCD is low at these short wavelengths (near 390 nm).
Bottom line: The emission in the line cores could not be detected.
LTE modelling using a Kurucz Atlas atmosphere model, and the SPECTRUM code by R. O. Grey.
The elements can be identified with the help of an atmosphere model (temperature and density startification) and a computed spectrum. A Kurucz model (with and without alpha element enhancement), of Teff=4250K, metallicity log[Fe/H]=-0.5, and log(gravity)=1.5 was used (an extracted model from an Atlas 12 super-model, containing many models for different Teff). The model without alpha element enhancement is shown below (the lines are sharper with enhancement, and the fit was not better, at least for this dataset). The cool6 linelist was used, kindly provided by prof. Richard Grey, to get TiO and other molecules (if present). The spectral line to the red side of the H and K lines display elements such as Mg (Manganese), Fe(Iron), Co (Cobalt), and Ti (Titanium), but not TiO (Titanium Oxide, as in Betelgeuse). The calculated spectrum was smeared with a 1.5 Angstrom Gaussian, to obtain a good fit. The spectrograph slit was opened a bit further than the minimum value, to about 30-40 micrometer, to get more photons. A microturbulent velocity of 2 km/s was used throughout the atmosphere.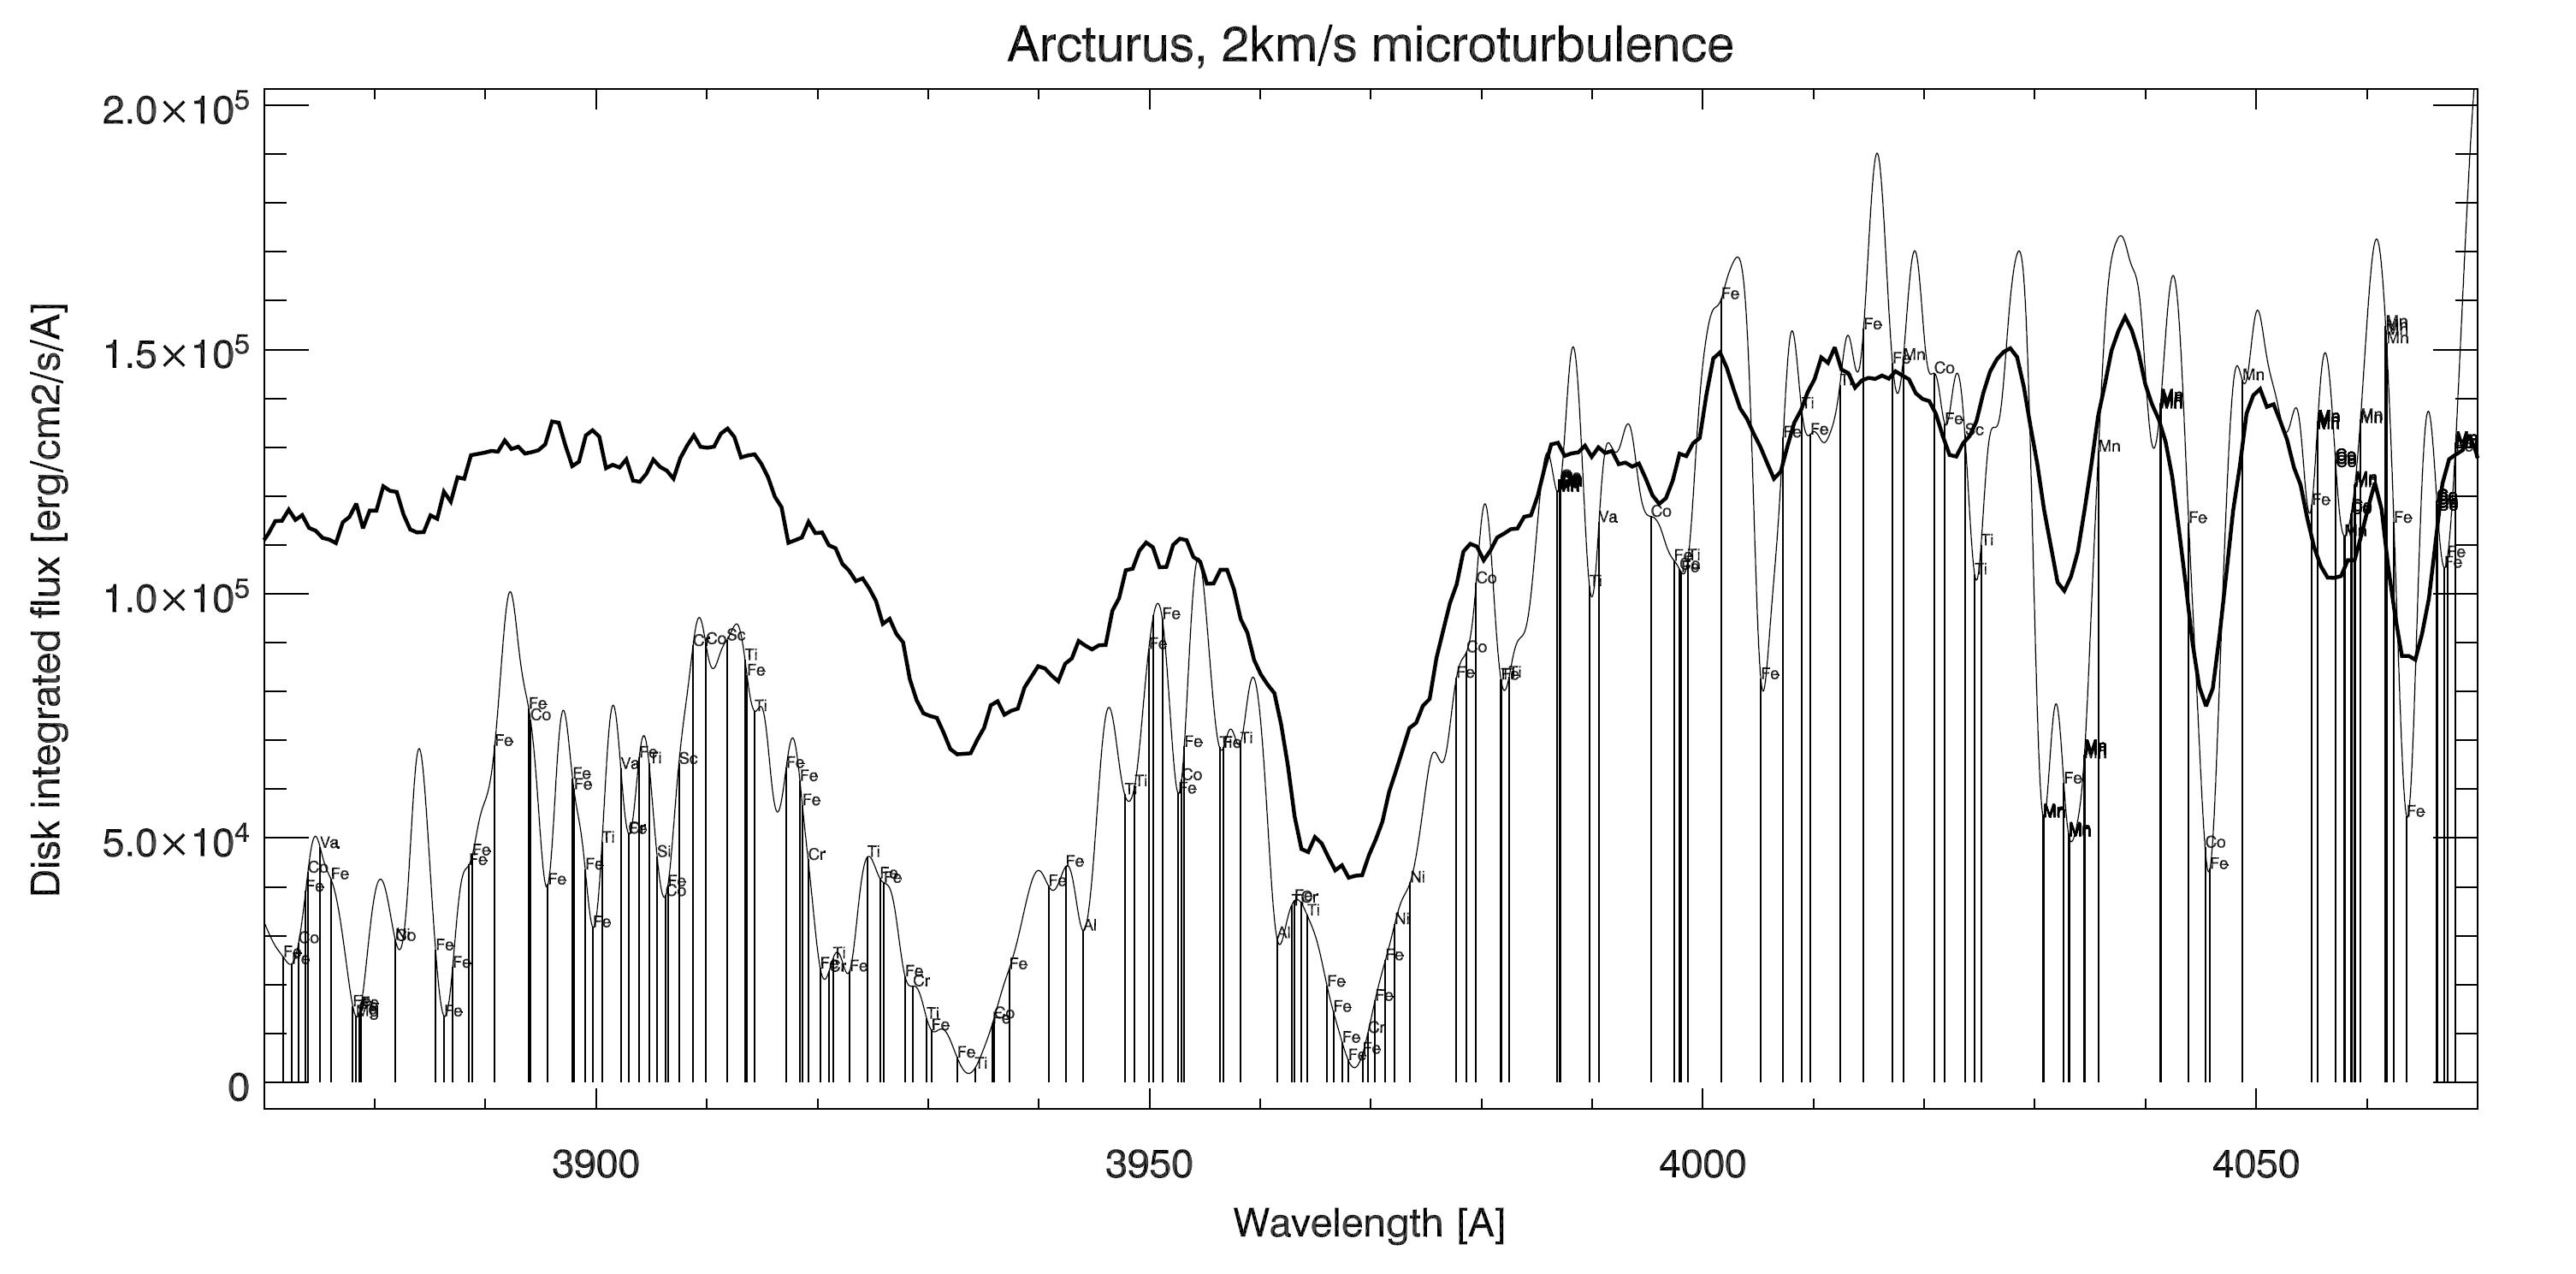
Caption: The spectrum of Arcturus near the broad Ca II H and K lines at 3933 and 3968 Angstroms. The thin line is the computed spectrum. The thick line is the measured spectrum, that has been normalized with the a smooth function representing the local continuum level, so it appears more flat than the computed spectrum. Most apparent spectral lines are a complex mix of lines from heavier elements. The elements are labeled, and for those lines that have equivalent widths greater than a few milli-Angstroms. The similarities between theory/model and data are good I think, even for this moderate S/N ratio. I recommend using "Ctrl +/-" for zooming in and out, otherwise the labels in the spectra are not necessarily readable! The QCSPEC was used with 1200 l/mm, and a narrow slit giving a resolution of about 1.5 A. The spectrograph was mounted on a 10 inch f6 Newtonian.
Metal line strengths in Arcturus, 407-430 nm
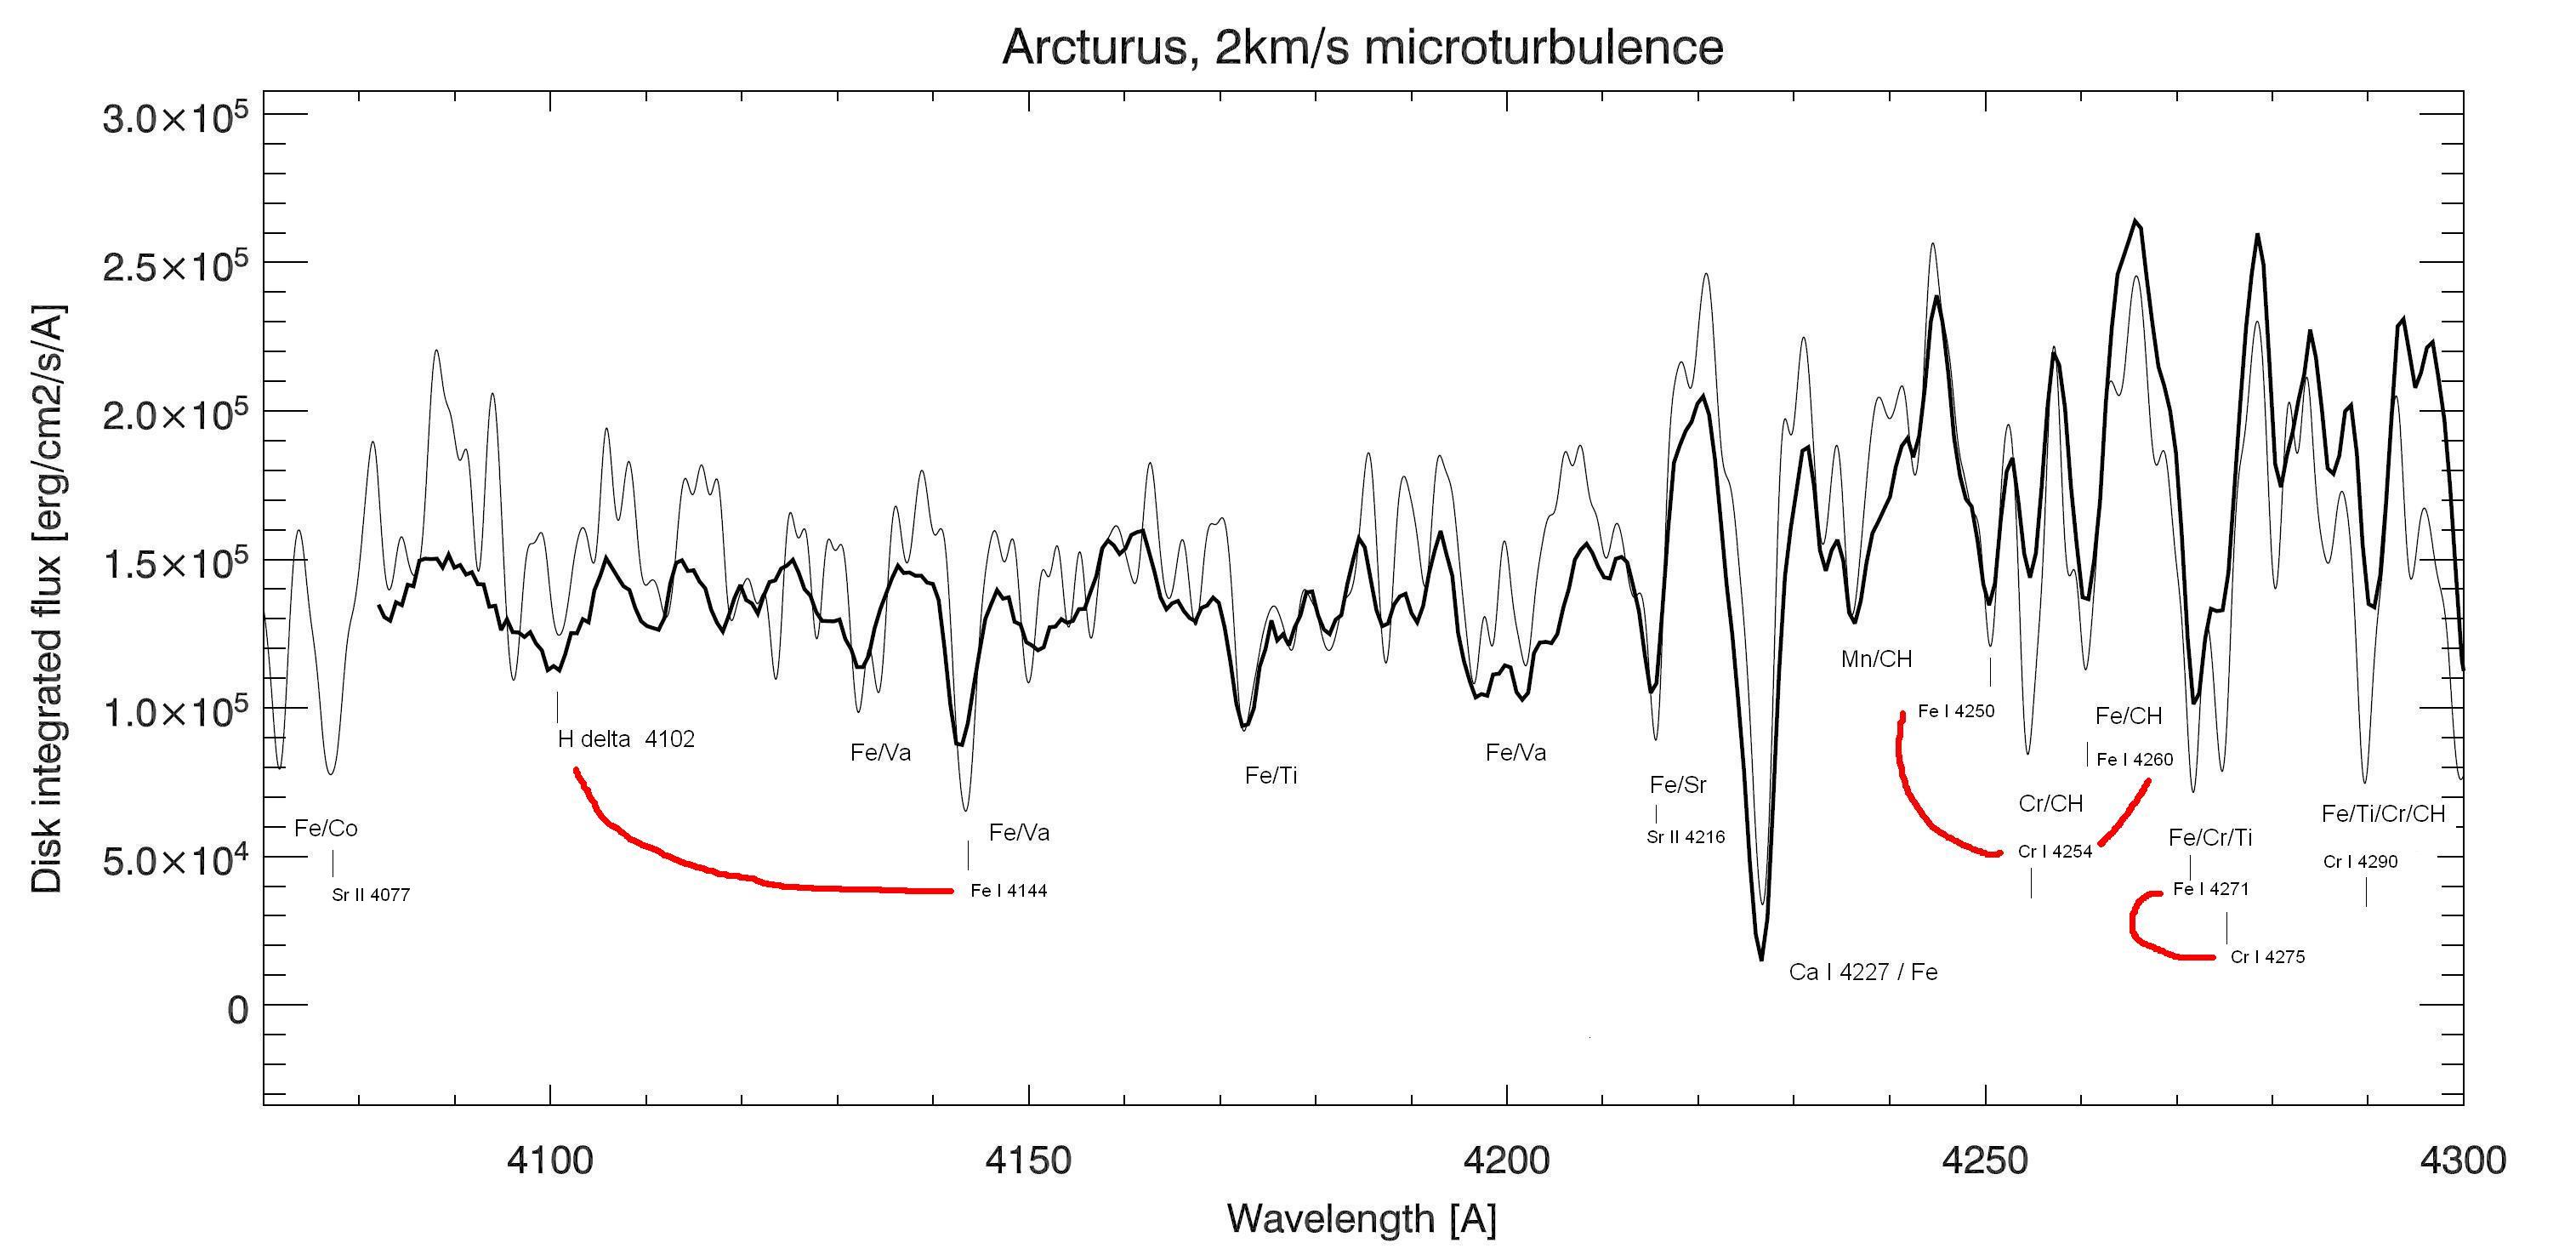
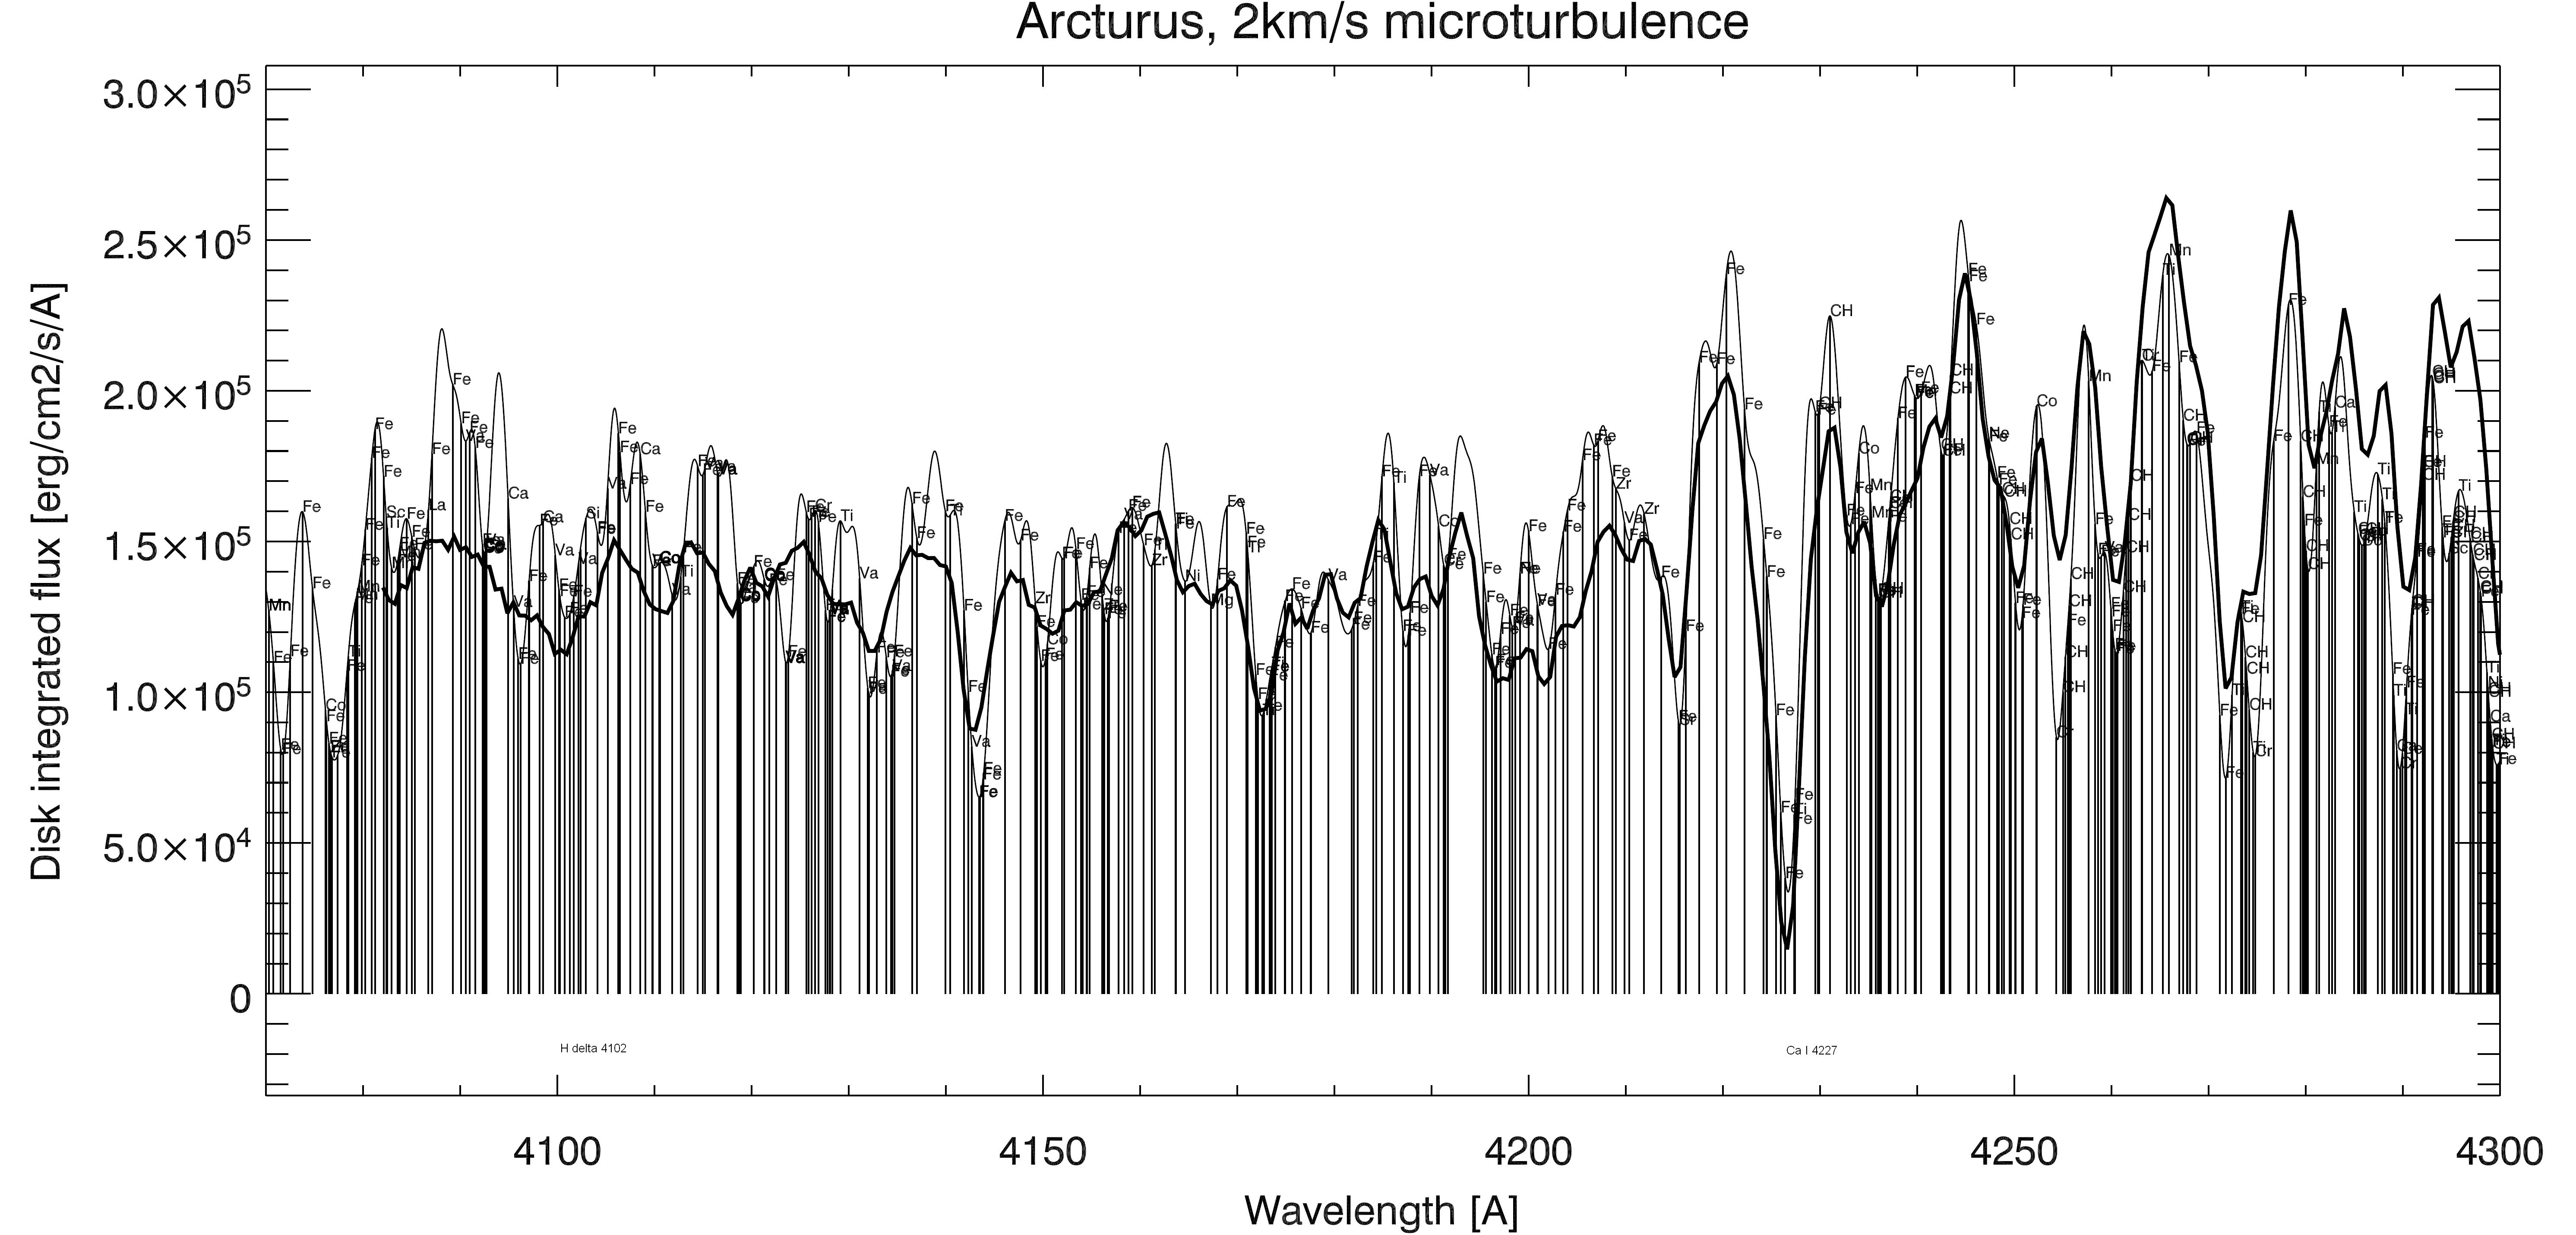
The spectrum in the range 4070 to 4300 A is shown below. In this range, the intnesity is considerably increased, with a much better S/N ratio. 16 exposures of only 20 sec each were added. The Balmer Hydrogen delta line is at 4102 A, but it is very weak in a haze of overlapping iron lines. A number of heavier elements can be seen, and the strongest is Calcium, at 4227 A (the Fraunhofer g-line is the Sun). The Fraunhofer G-band of the CH-molecule starts at the right edge of the spectrum near 4300 A. The more detalied labels on the bottom figure show an increasing amount of lines from CH at this end. Both the Calcium line and the CH band is found in the solar spectrum, and the Sun is a G2V star while Arcturius is a giant of spectral class K1.5III. The calculated spectrum was smeared with a 1.5 Angstrom Gaussian, to obtain a good fit. A microturbulent velocity of 2 km/s was used throughout the atmosphere, also in this case. The SPECTRUM code adopts plane parallel geometry and LTE. Still, the model represents the measured spectral features quite well.
A few strong Fe I lines and Cr I lines are marked at the specific wavelegths. The line ratios, in terms of equivalent widths between line pairs indicated by the red connecting lines, are used to determine the precise type of stars within the G and K classes (Gray and Corbally 2008). The metal lines (Fe, Cr, Ca) to hydrogen lines measure the metallicity and temperature, as the metal lines increase in strength for lower temperature. The Fe/Cr ratios can be used to measure the precise type of K star. It is encouraging that the current spectral resolution around 1 A is in fact sufficient for measuring these line ratios (Gray and Corbally 2008), and this open up the possibility of "useful" spectroscopy work with this kind of equipment, provided that the exposure times are long enough to get good signal to noise ratios (S/N).